Hands-On EC2 Monitoring with Amazon CloudWatch
I built a basic monitoring setup around an EC2 instance. I started with the metrics EC2 publishes on its own. Then I made a CPU alarm that emails me through SNS. I installed the CloudWatch Agent for OS metrics and Apache logs. Last, I put the useful signals on one dashboard.
EC2 monitoring with CloudWatch metrics, alarms, logs, and dashboards
It helped me keep the pieces straight:
- EC2 publishes infrastructure metrics such as CPU utilization.
- CloudWatch alarms evaluate metrics and change state.
- Amazon SNS delivers notifications.
- CloudWatch Agent collects guest OS metrics and log files.
- Dashboards bring alarms and metrics into one view.
Part 1: Building and testing a CPU alarm
1. Launching the instance
I launched an Amazon Linux 2 instance and waited for its status checks to pass.

The running EC2 instance I monitored with CloudWatch
For production I’d keep admin access private with Session Manager or another controlled path.
2. Looking at built-in metrics
In the EC2 console I opened the instance’s Monitoring tab. The default charts showed CPU, status check failures, and network traffic.
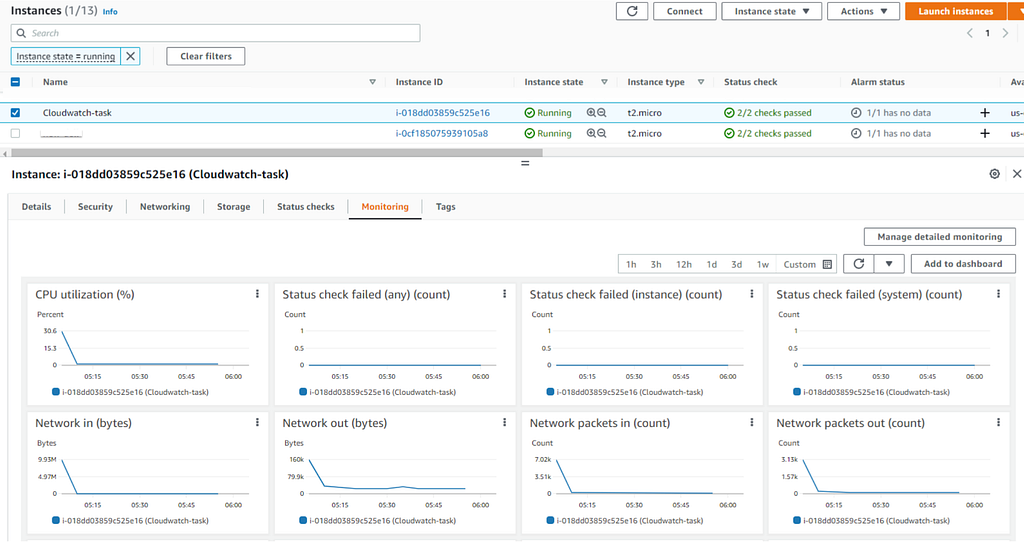
Standard EC2 metrics on the instance Monitoring tab
These come from the EC2 service. Memory and disk usage aren’t included because AWS can’t see inside the OS. I added those later with the agent.
3. Installing a CPU load tool
On the Amazon Linux 2 instance I installed stress:
sudo amazon-linux-extras install epel -y
sudo yum install stress -y
Newer Amazon Linux versions package things differently. Use your distro’s supported package source.
4. Picking CPUUtilization
In CloudWatch I went to Alarms → All alarms → Create alarm and picked a metric. I chose the EC2 namespace:
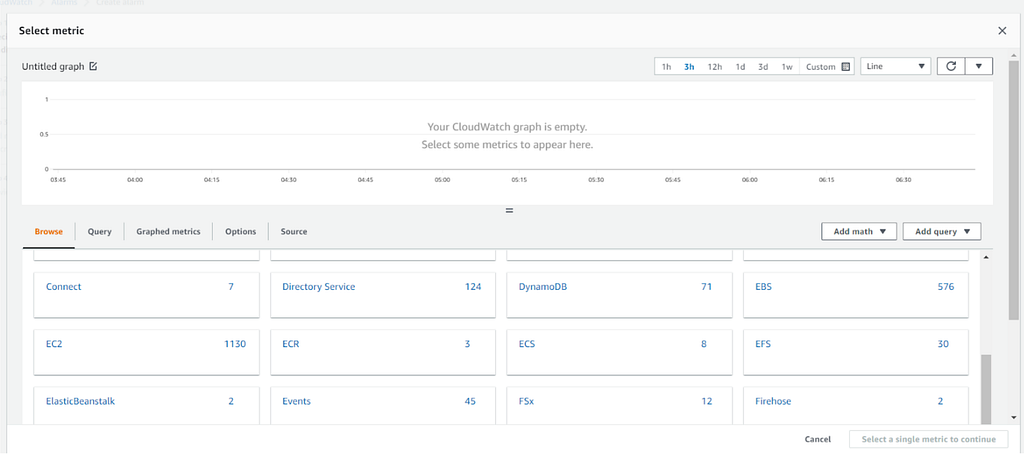
Selecting the EC2 metric namespace
Under Per-Instance Metrics I filtered by instance ID and picked CPUUtilization.
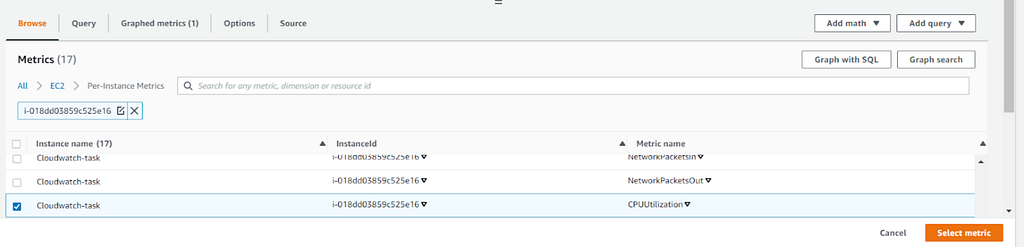
Selecting CPUUtilization for the target instance
I used a low threshold and a short evaluation period so it would trigger fast. That would be way too noisy in production. A real threshold should match the app’s normal behavior. It needs enough evaluation periods to ignore short spikes, and it should handle missing data. Anomaly detection helps when a workload has a steady pattern.
5. Adding an SNS notification
I set the alarm to notify an SNS topic when it hits ALARM and added my email.
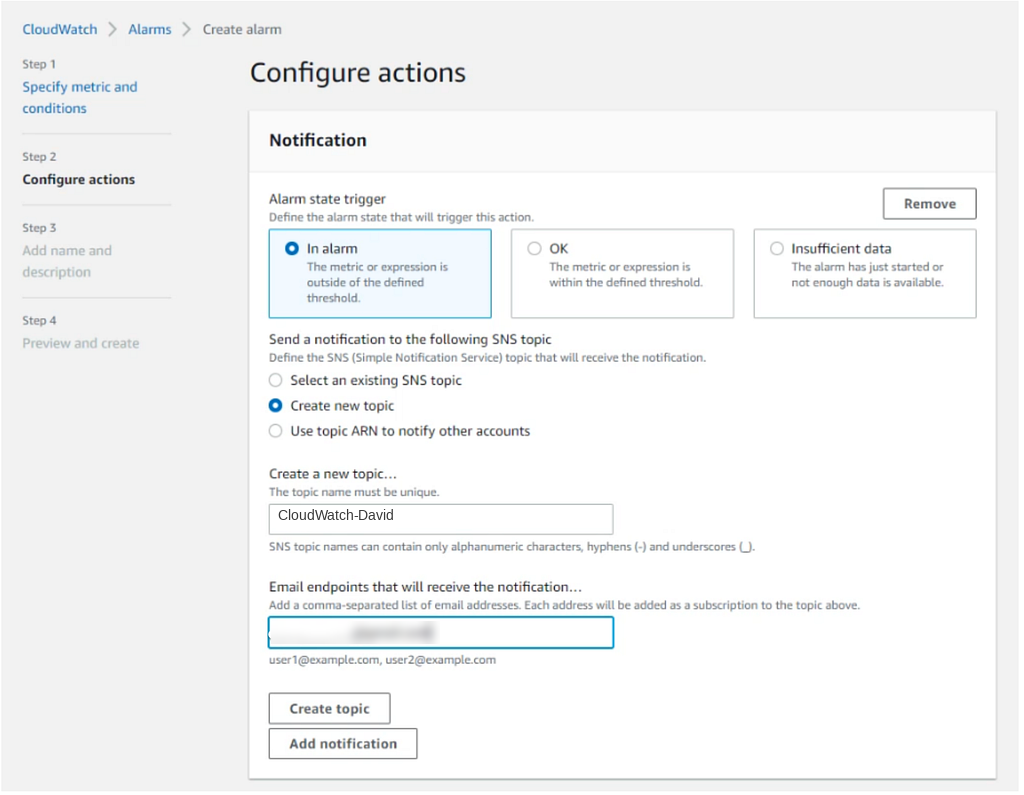
Creating an SNS email notification for the alarm
AWS sent a subscription confirmation email.
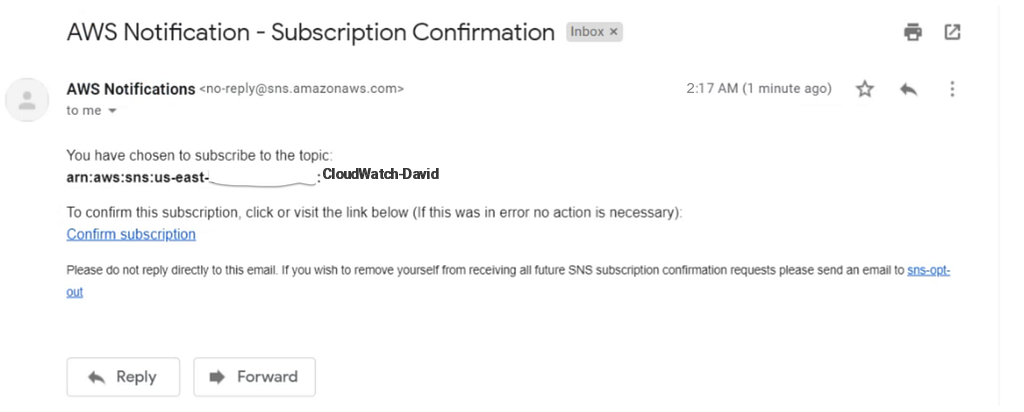
The SNS subscription confirmation email
I confirmed it before testing. SNS won’t send anything to the email until you do.
6. Generating CPU load
I ran stress with ten CPU workers for 400 seconds:
sudo stress --cpu 10 --timeout 400s --verbose
In a second session I watched it with:
top
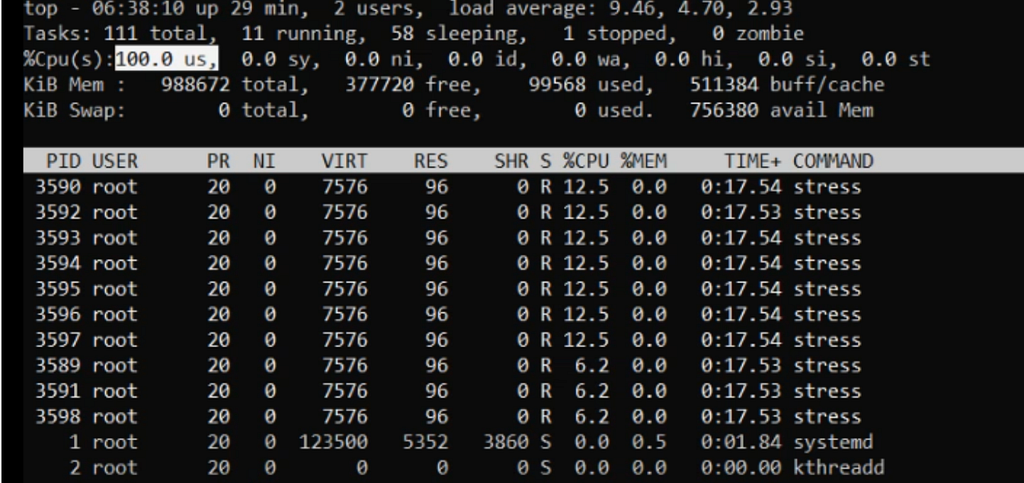
The stress workers driving CPU utilization to 100 percent
This was on a throwaway instance. Never run stress on a production server without a planned performance test and approval.
Once CloudWatch had enough data points, the alarm fired and SNS emailed me. I stopped the load and watched the alarm go back to OK.
Part 2: Guest metrics and Apache logs
7. Letting the instance publish telemetry
I created an EC2 IAM role and attached:
CloudWatchAgentServerPolicy
Then I assigned the role to the instance.
I didn’t attach CloudWatchFullAccess. The agent only needs to publish metrics and logs. If the config lived in Parameter Store or data went somewhere else, I’d add tight permissions for just those resources.
8. Installing Apache and the agent
I installed and started Apache:
sudo yum update -y
sudo yum install httpd -y
sudo systemctl enable --now httpd
Then I installed the CloudWatch Agent:
sudo yum install amazon-cloudwatch-agent -y
I checked its state with:
sudo /opt/aws/amazon-cloudwatch-agent/bin/amazon-cloudwatch-agent-ctl \
  -m ec2 -a status
9. Building the agent config
I ran the configuration wizard:
sudo /opt/aws/amazon-cloudwatch-agent/bin/amazon-cloudwatch-agent-config-wizard
The wizard lets you pick the OS metrics and log files to collect. For Apache on Amazon Linux 2 I added:
/var/log/httpd/access_log
/var/log/httpd/error_log
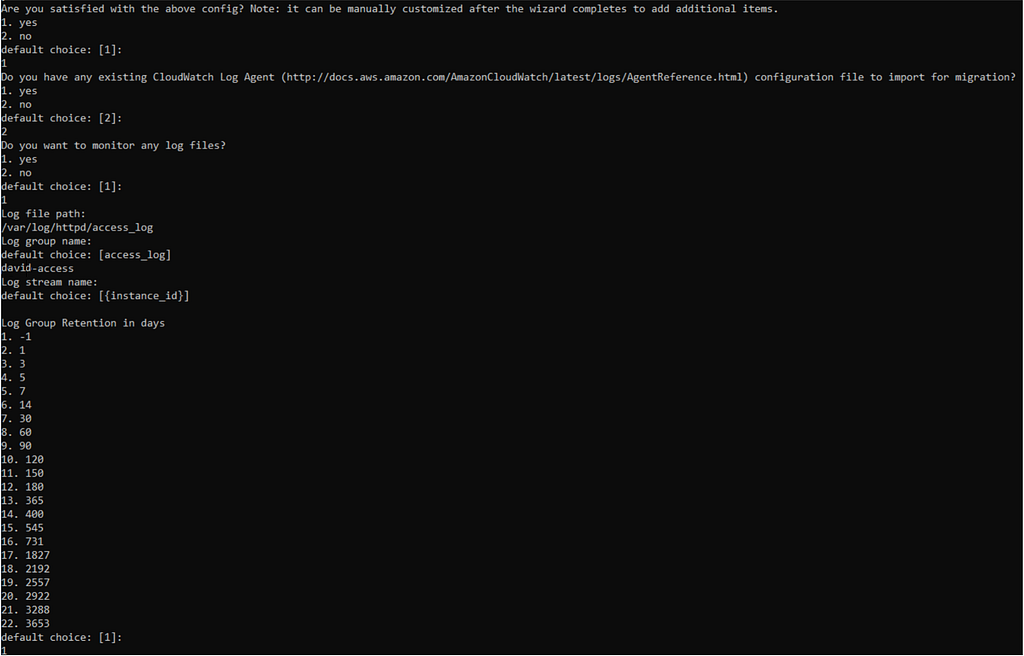
Adding the Apache access log in the CloudWatch Agent wizard
Use clear log group names, not personal names like the ones in my screenshot. I left retention at Never expire in this lab. In production, set a retention period.
After saving the config, I loaded it and started the agent:
sudo /opt/aws/amazon-cloudwatch-agent/bin/amazon-cloudwatch-agent-ctl \
  -a fetch-config \
  -m ec2 \
  -s \
  -c file:/opt/aws/amazon-cloudwatch-agent/bin/config.json
Then I checked the agent status and logs. A config mistake can quietly leave a gap in monitoring.
10. Checking the log groups
In CloudWatch → Log groups, the Apache access and error log groups showed up once the agent sent its first records.

Apache access and error log groups in CloudWatch Logs
For production I’d encrypt sensitive log groups, set retention, and lock down IAM access. I’d also add metric filters or Logs Insights queries for useful app events.
11. Checking the agent metrics
In CloudWatch Metrics the CWAgent namespace showed up with the new guest metrics.
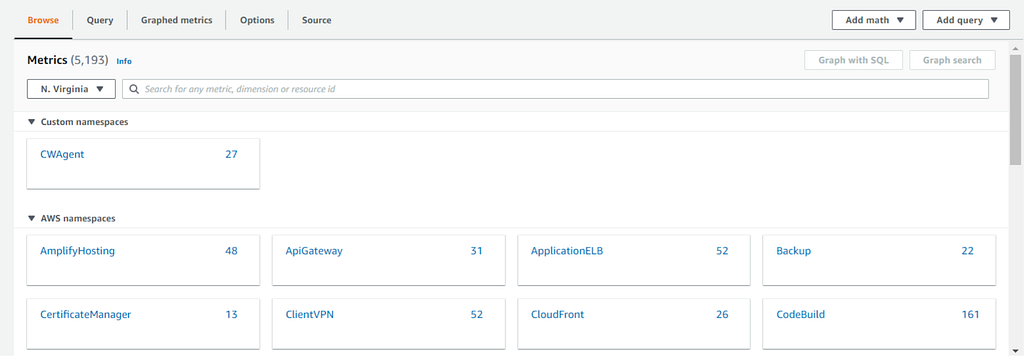
The CWAgent custom metric namespace
I opened mem_used_percent and confirmed data was coming in for the right instance.
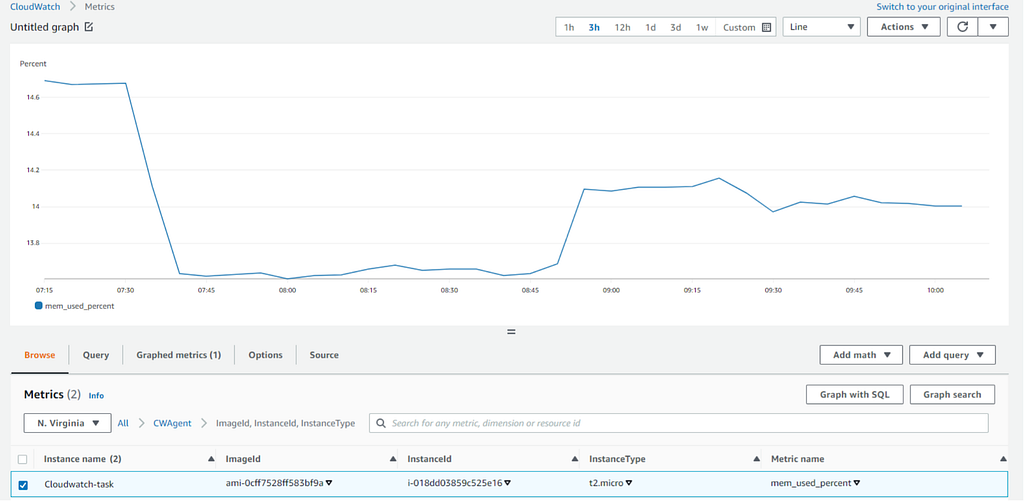
Memory utilization collected from inside the EC2 instance
I collected disk usage too. Custom metrics cost extra, especially with short intervals and lots of dimensions. Only collect what you’ll actually use.
Part 3: Building a dashboard
12. Creating the dashboard
I opened CloudWatch → Dashboards, created one, and looked through the widget types.
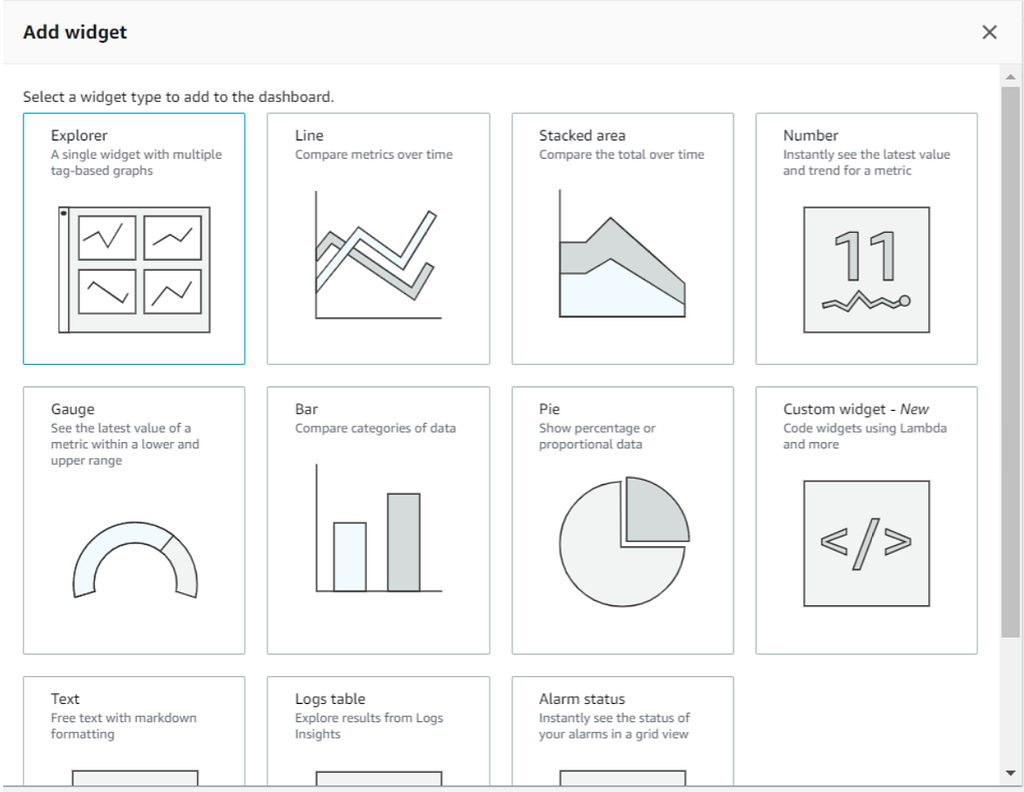
Choosing a CloudWatch dashboard widget
I started with an Alarm status widget for the CPU alarm.
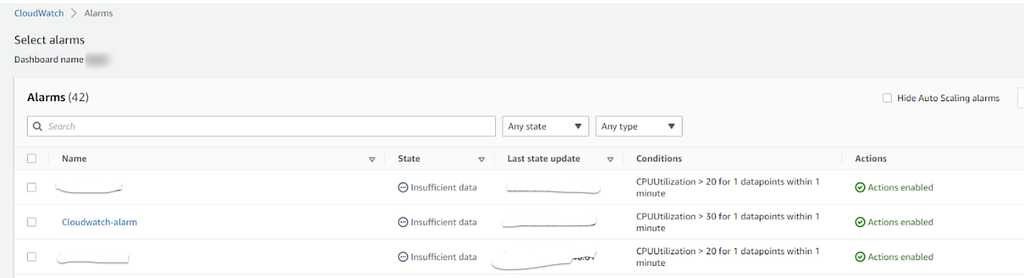
Selecting the CPU alarm for the dashboard
Then a line widget for disk_used_percent and mem_used_percent.
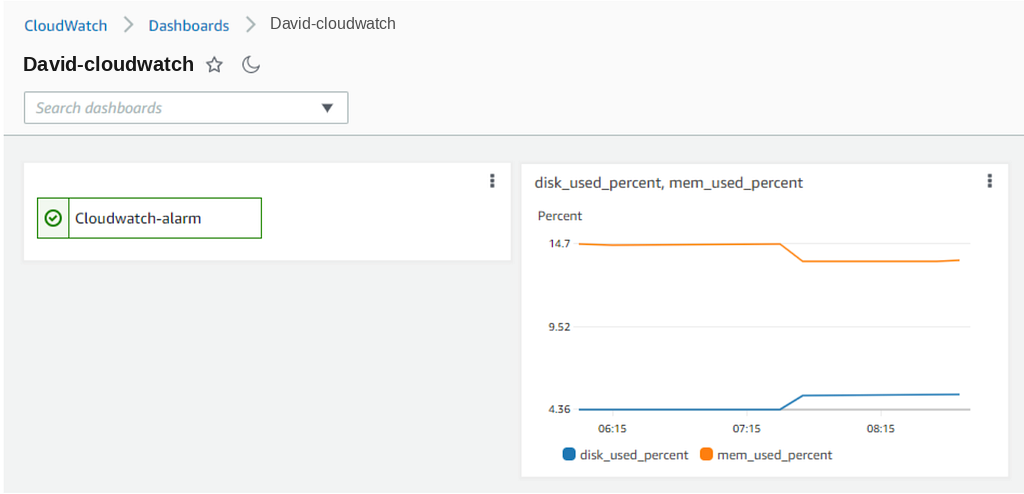
The completed dashboard with alarm, disk, and memory monitoring
Now I had one place to see the alarm and key guest metrics. It doesn’t replace notifications or incident response. Dashboards work best when the alarms, owners, and runbooks behind them are already clear.
Result
The instance was now monitored at the AWS layer and inside the OS. EC2 metrics gave CPU and network data. The alarm watched CPU. SNS sent the alert. The agent added memory, disk, and Apache logs. The dashboard pulled the best signals into one view.
Before production I’d add alarms for status check failures, memory and disk pressure, missing agent data, and app errors. I’d route alerts to someone who owns them and set log retention. I’d test every alarm. And I’d write down what to do when each one fires.