Azure Site Reliability Engineering Agent goes after the first part of an incident. That’s the part where you gather evidence, check service health, line up telemetry, read code, and figure out where to look next.
I set it up, connected it to my code and telemetry, and pushed it through a few real tests. This post covers setup, governance, investigations, and automation.
Note: Azure SRE Agent became generally available in March 2026. When I tested it, several features were still in preview or changing. That includes networking, hooks, role behavior, and parts of the incident workflow. Treat product details here as what I saw at the time, not permanent behavior.
1. What Azure SRE Agent is
The idea is to pull all the operational context into one investigation. You don’t have to jump between dashboards, repos, incident tools, logs, and deployment history yourself.
It can:
investigate incidents
correlate logs, metrics, traces, and deployments
review source code
query Application Insights and Log Analytics
use built-in and custom tools
run scheduled or HTTP-triggered automations
build reports
store working knowledge
connect to incident systems
Here’s how I think about it:
Observability + Code + Incidents + Azure resources
                     |
                     v
               Azure SRE Agent
                     |
        +------------+-------------+
        |            |             |
     Explore      Diagnose      Recommend
        |            |             |
        +------------+-------------+
                     |
              Human approval
             or autonomous action
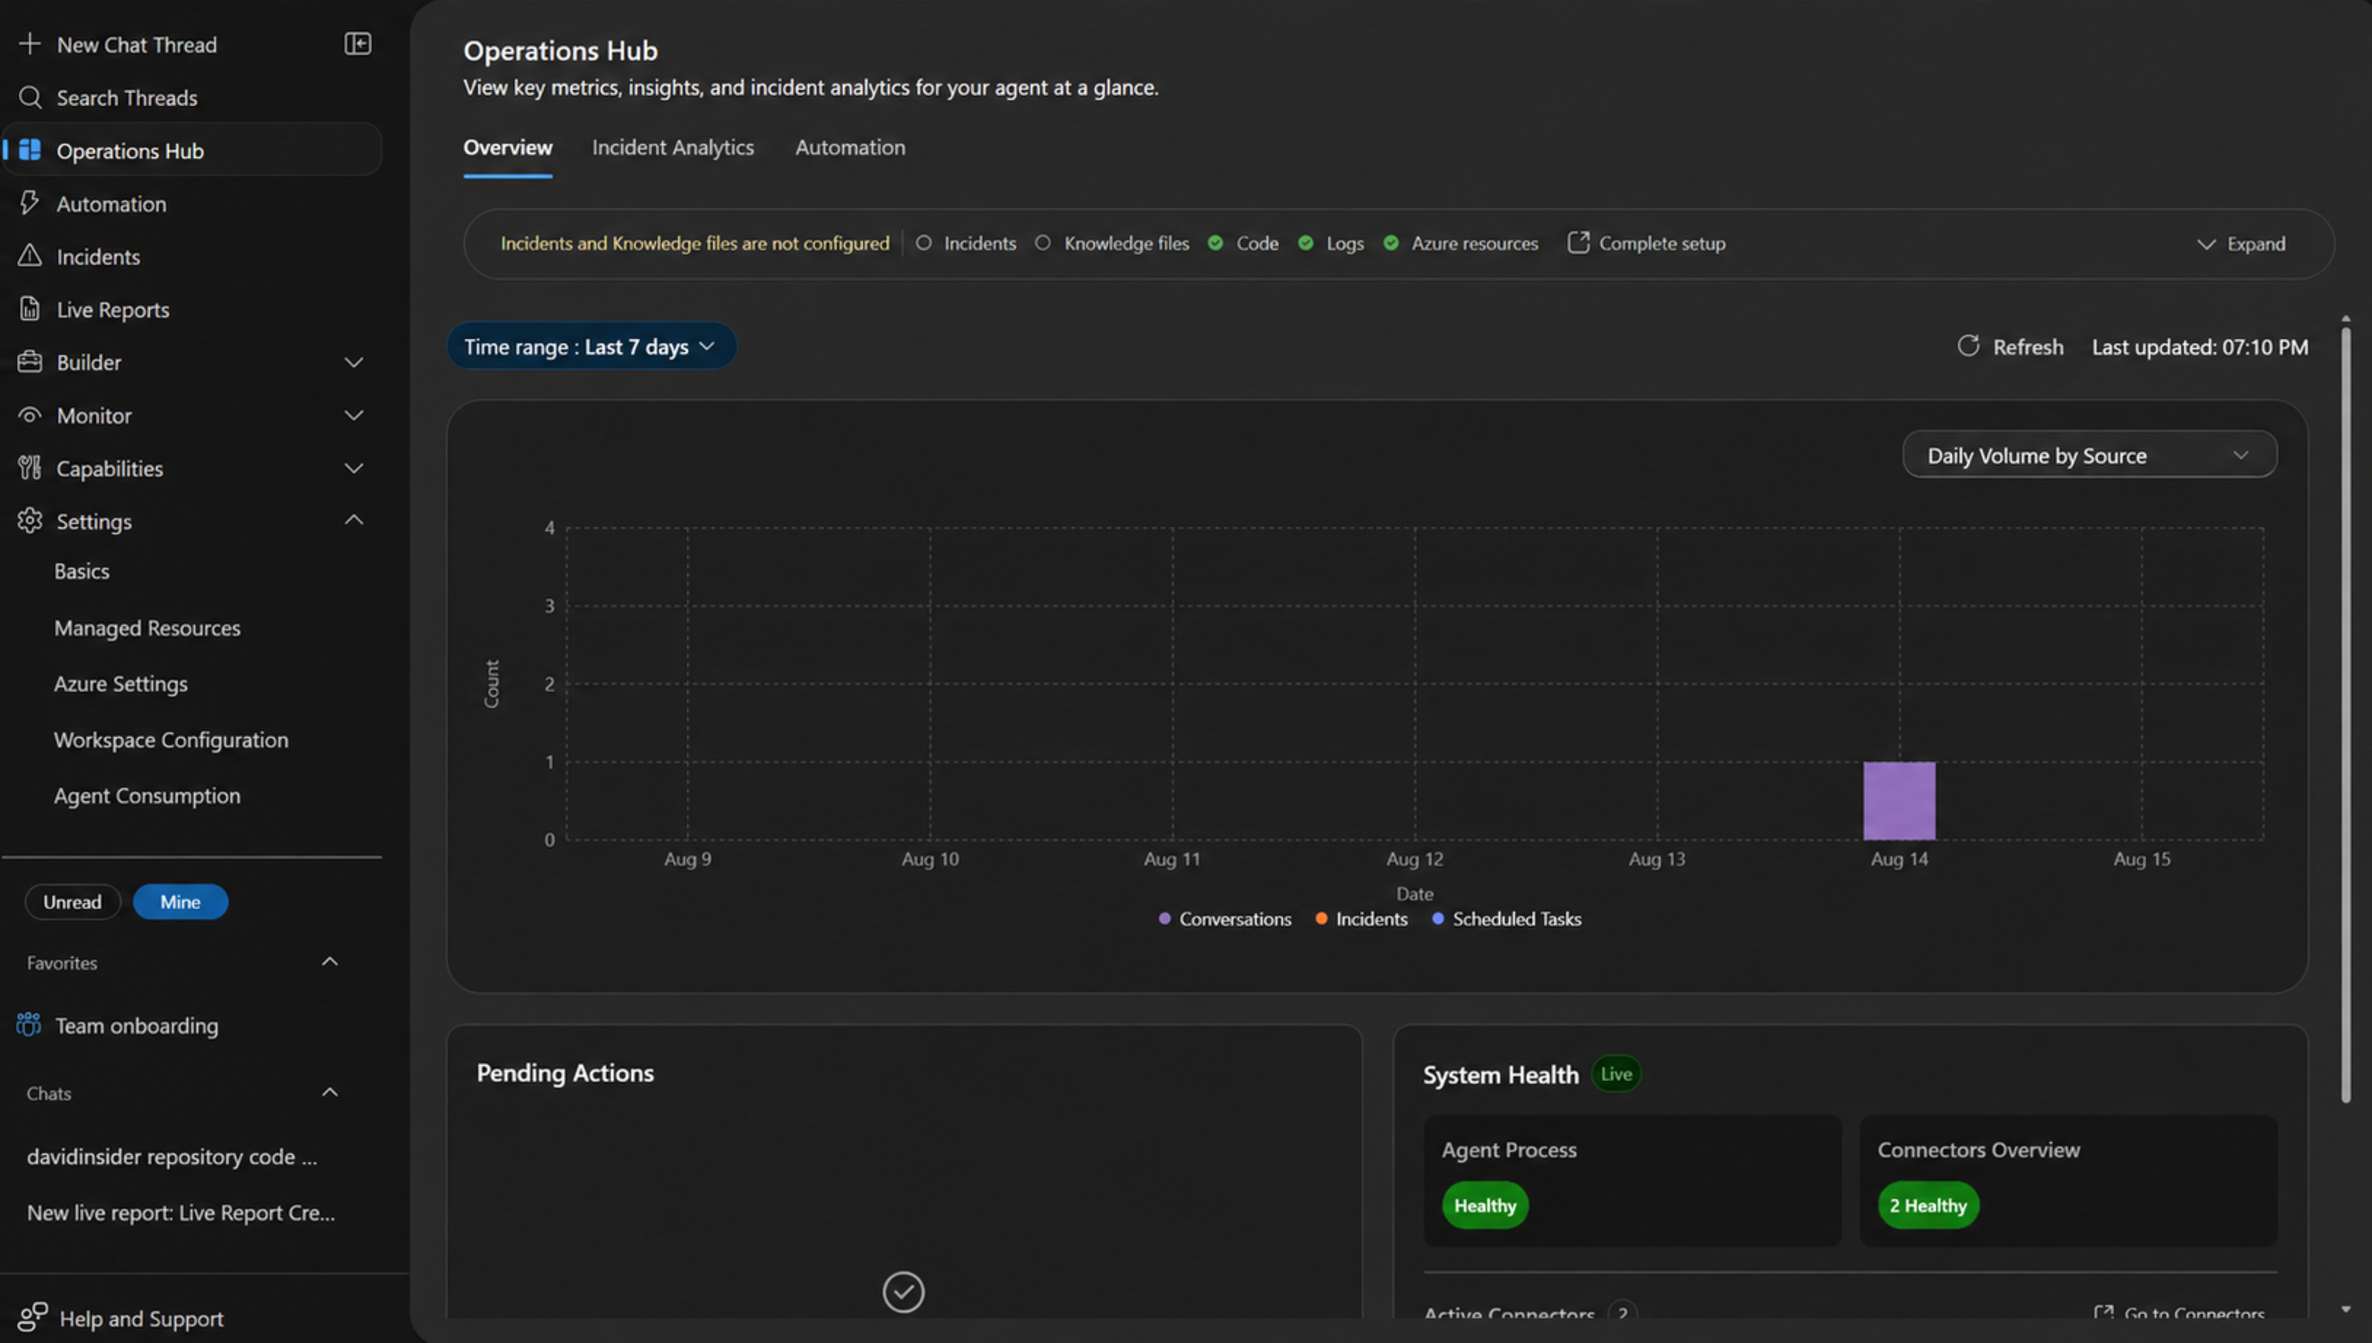
The Operations Hub is the main entry point. It shows which resources and connectors are available, whether the agent is healthy, and whether any actions are waiting for approval.
Operations Hub showing connected sources, pending actions, and system health
It comes with six built-in subagents:
Explore
Plan
CodeReview
Bash
Verification
GeneralPurpose
You can extend them with custom skills, Python tools, MCP servers, and automation triggers.
2. Scheduled tasks and HTTP triggers
The Automation blade has two trigger types:
Scheduled task
HTTP trigger
A scheduled task runs on a timer. An HTTP trigger gives you an endpoint that another system can call, like Azure Monitor, Logic Apps, Event Grid, or an Azure Function.
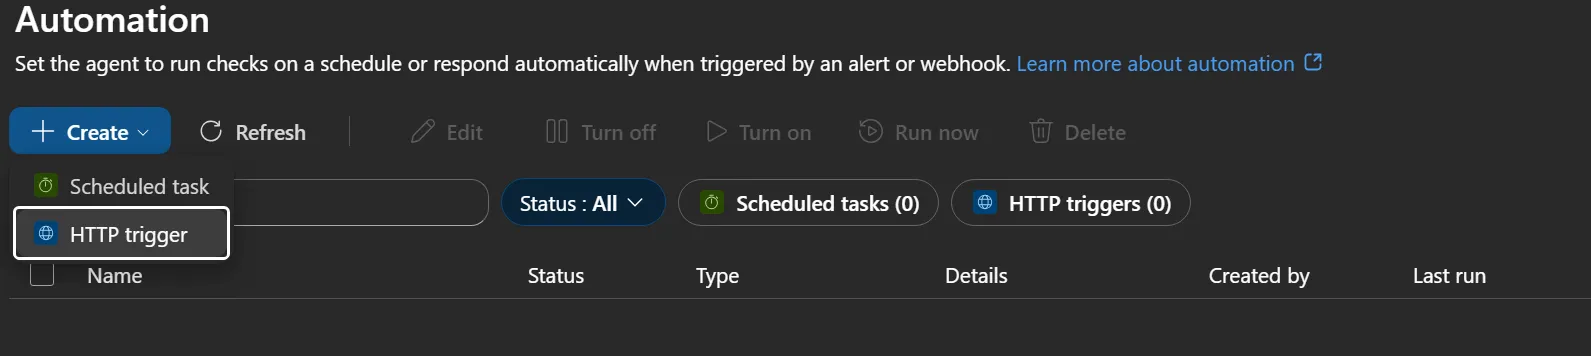
Automation Create menu showing Scheduled task and HTTP trigger
HTTP triggers keep their own run history. You can test them by hand before hooking them to a real alert.
There’s also message grouping. Repeated events can land in the same chat thread or start a new one each time.
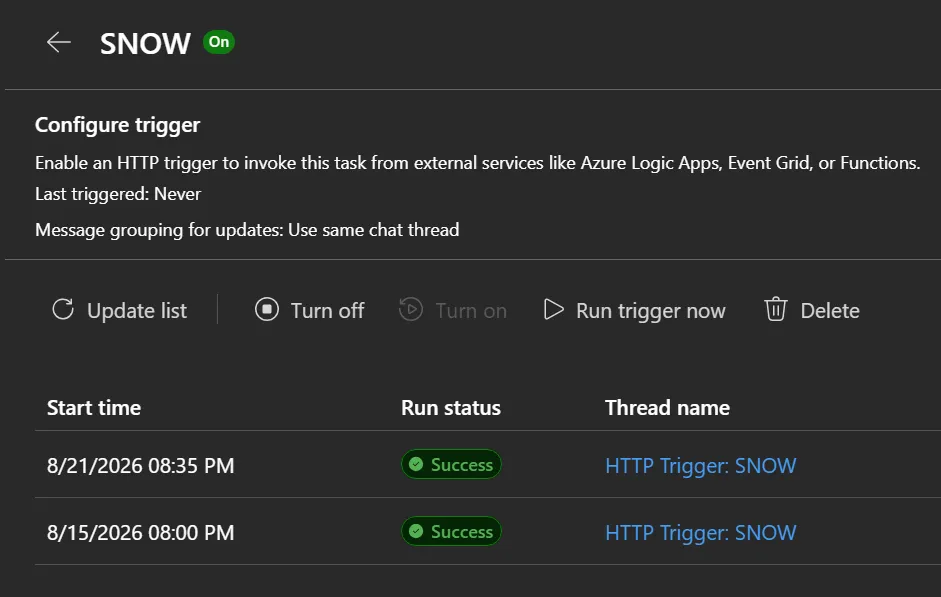
HTTP trigger configuration with trigger status, grouping behavior, and run history
I hit one UI quirk. It said Last triggered: Never even though successful runs showed right below it. When those two disagree, trust the run history.
3. The default approval model
Out of the box, the agent recommends first. It doesn’t act on its own.
The default flow:
investigate
explain
propose
wait for approval
You can change that. A response plan or scheduled task can run in autonomous mode and do approved kinds of actions without waiting for anyone.
That’s worth understanding. The product isn’t always human-in-the-loop and it isn’t always autonomous. It depends on how you set up each task or plan.
4. Controlling each connector tool
Once a connector is set up, you can govern each of its tools separately.
There are two basic states:
Allow
Ask
Allow lets the agent use the tool unattended.
Ask makes it request permission first.
My Microsoft Teams connector exposed 71 separate tools. It wasn’t one all-or-nothing package.
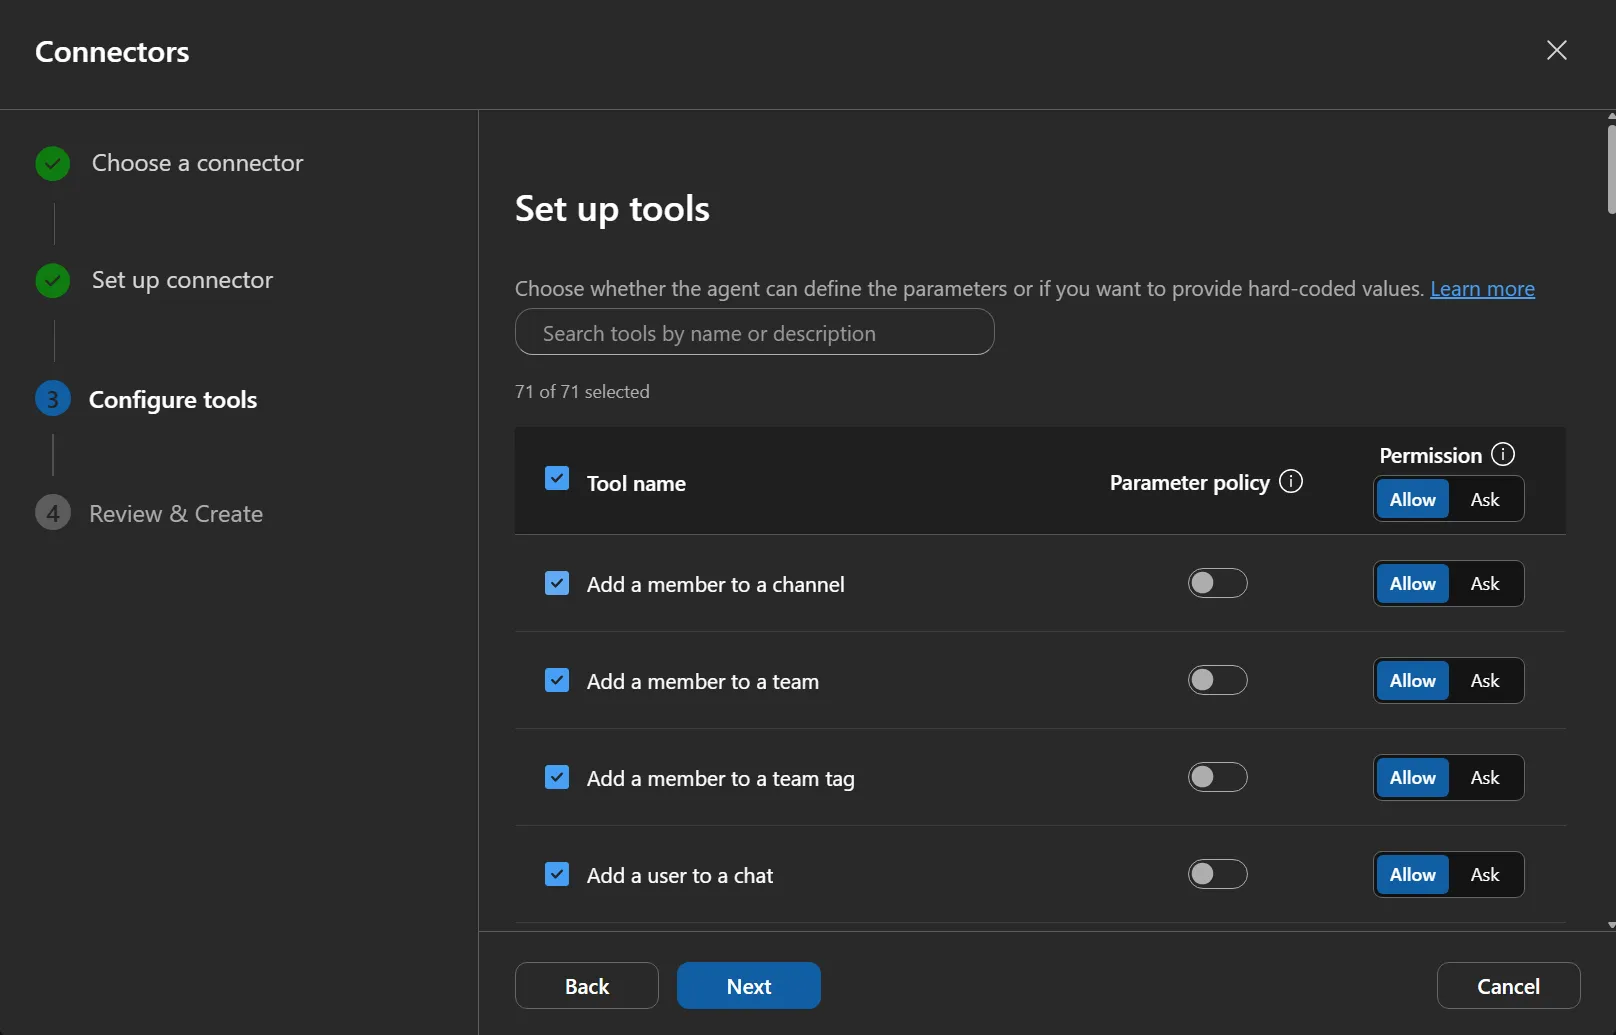
Connector tool configuration with per-tool Allow and Ask permissions
The Connectors page groups things like this:
Notification
Telemetry
MCP
Other
In my setup, Outlook and Teams were notification connectors. Application Insights handled telemetry. GitHub and Microsoft Learn showed up as MCP connections. Microsoft Graph was listed on its own.
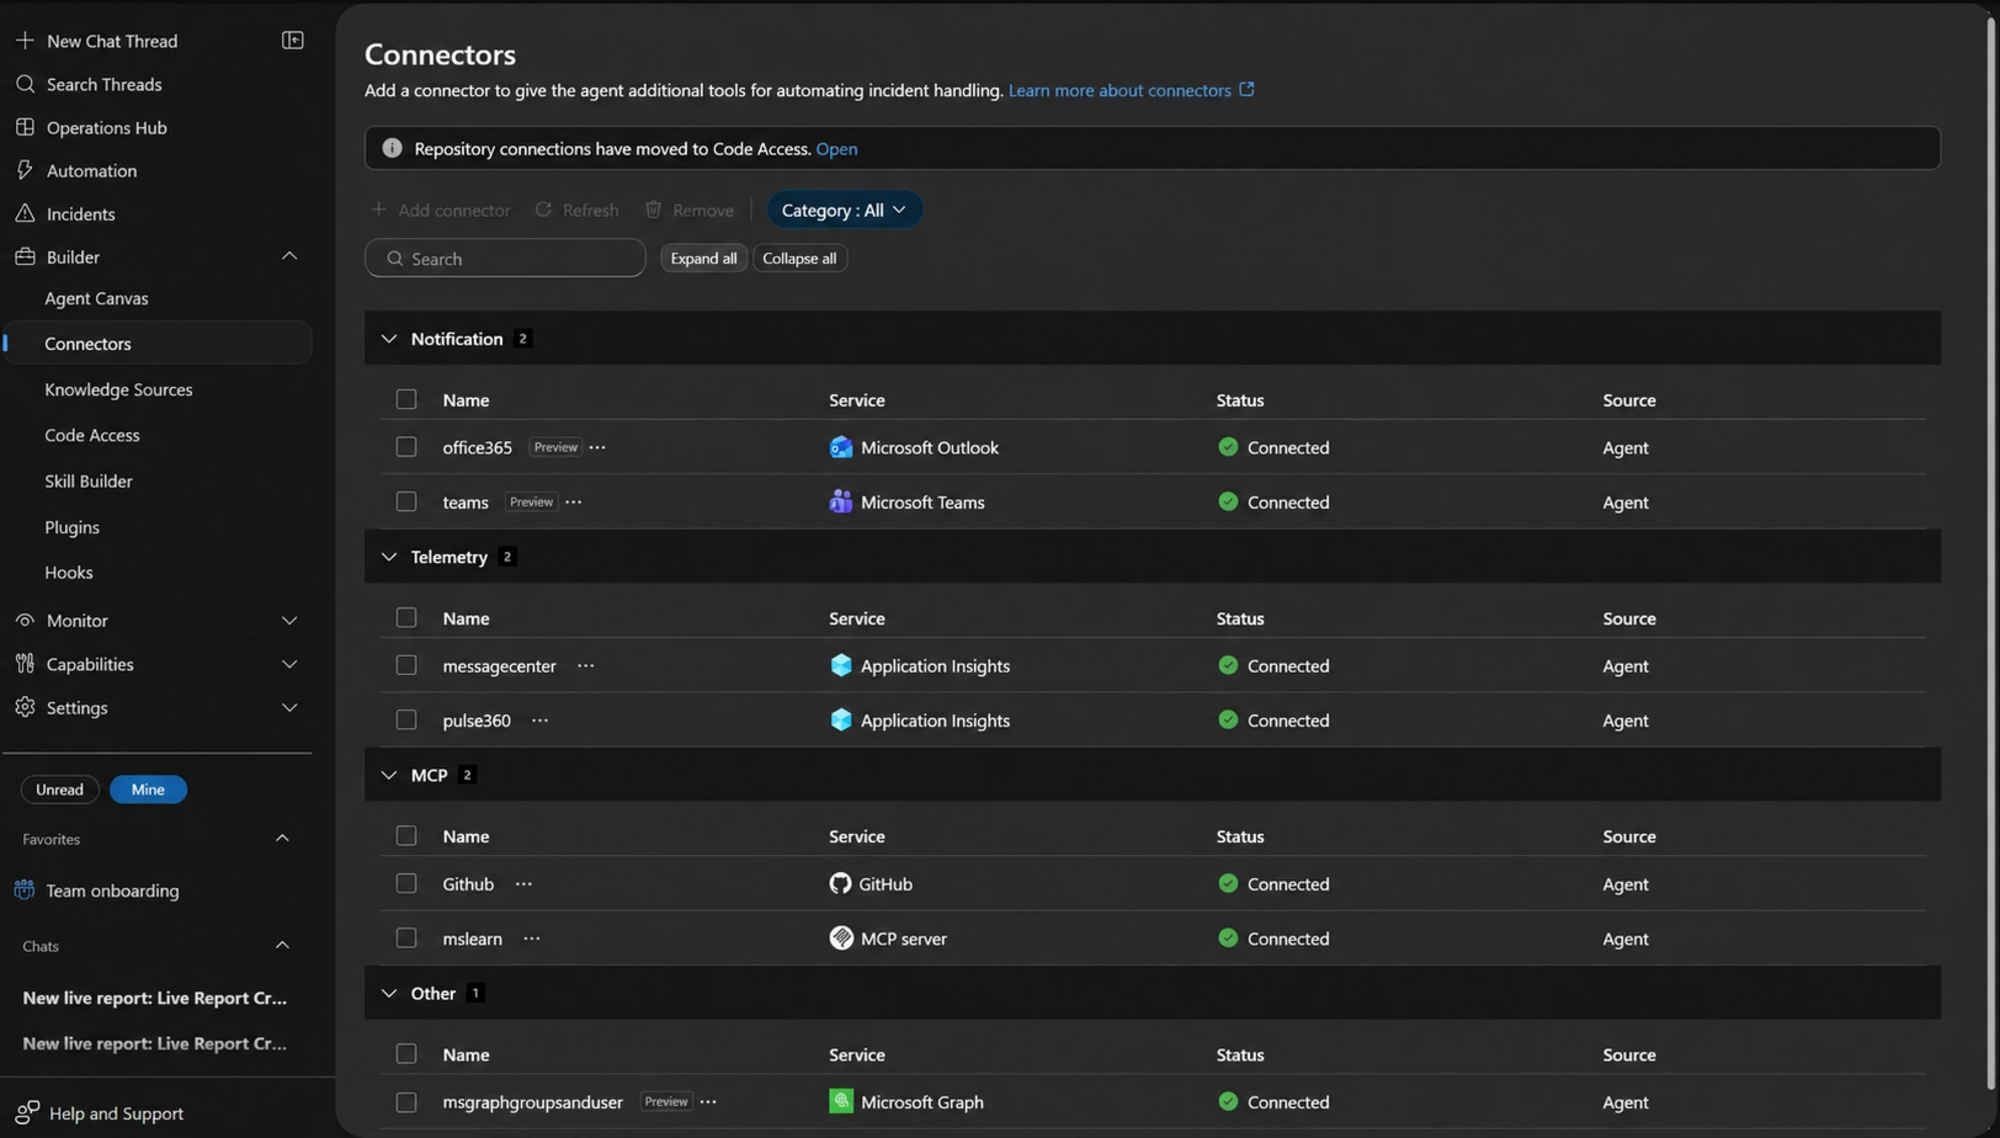
Connectors page grouped by Notification, Telemetry, MCP, and Other
Repo access had moved out of Connectors into its own Code Access area.
5. Adding plugin marketplaces carefully
The agent supports a plugin marketplace.
A new agent had no marketplace registered. The Plugins page stayed empty until I added one.
The Add Marketplace dialog had presets for:
Azure SRE Agent Plugins
Claude Plugins
You can also add a custom GitHub repo with:
owner/repo
github.com URL
GitHub Enterprise URL
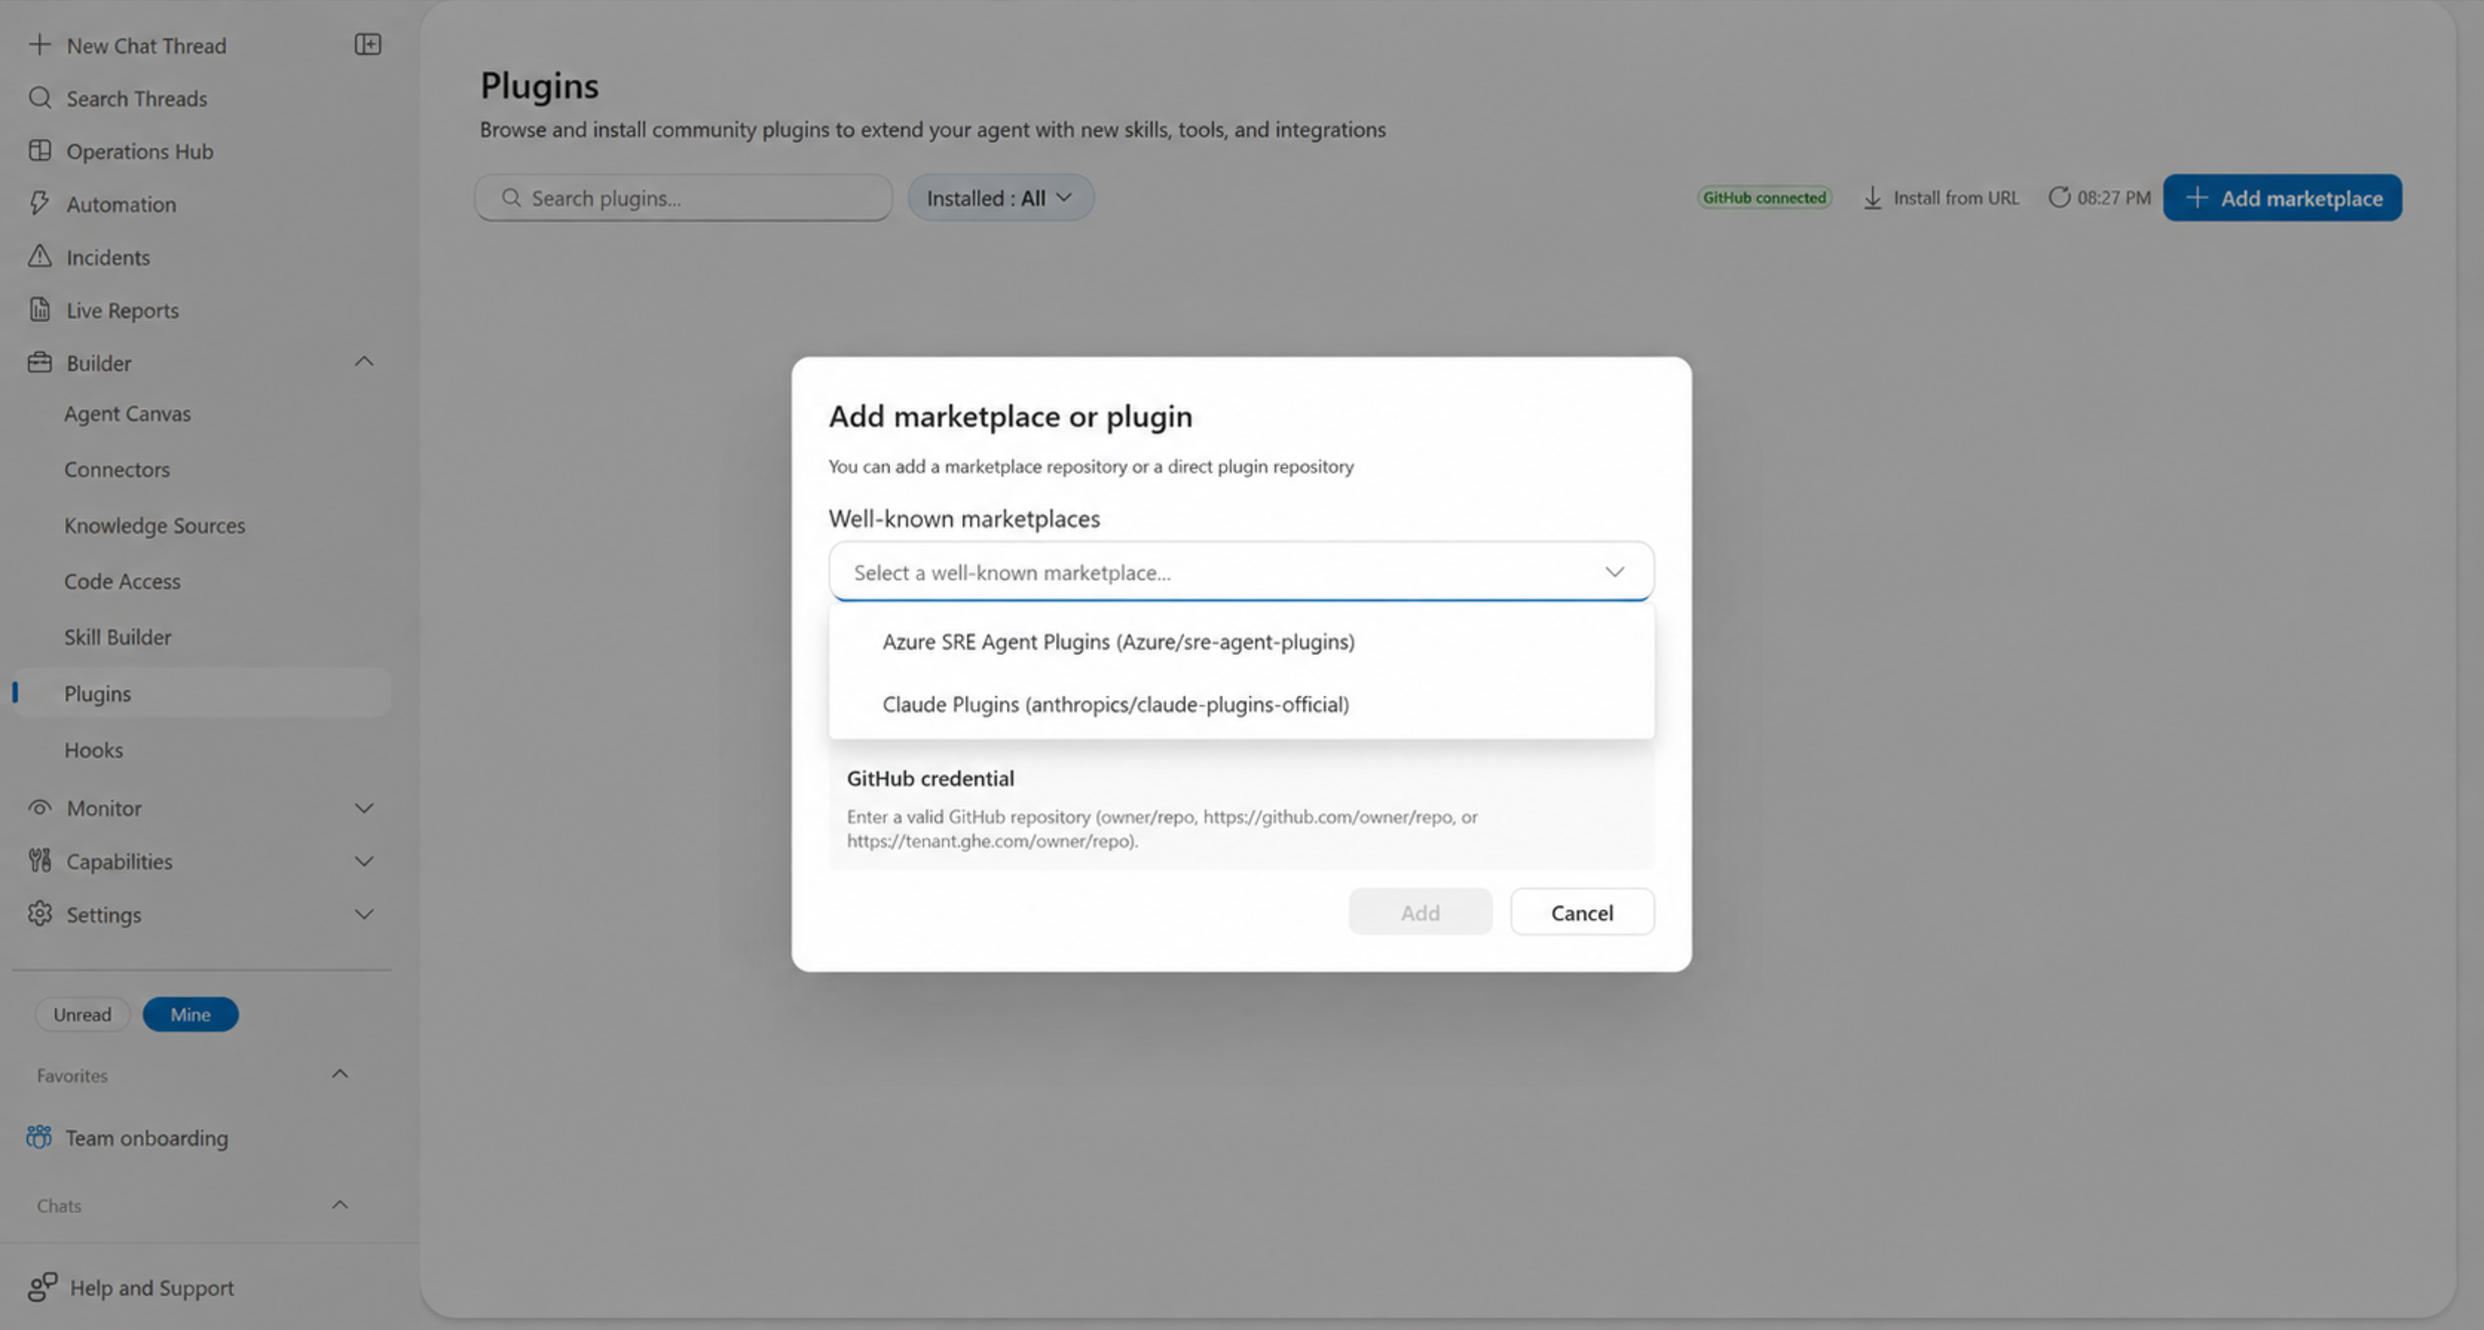
Add Marketplace dialog with Azure and Claude plugin repositories
Installed content is pinned to a specific Git commit. Upstream changes can’t quietly change what you already installed.
Watch out with private marketplaces. The credential is stored at the marketplace level. Anyone with SRE Agent Author or Administrator rights may be able to install from it, even if their own GitHub access wouldn’t let them see that repo.
So the real control point is SRE Agent RBAC, not GitHub repo membership.
6. The agent is an Azure resource
An SRE Agent is just another Azure resource.
You start with the usual boundaries:
subscription
resource group
region
I created mine through:
sre.azure.com
and it lists each agent with its region.
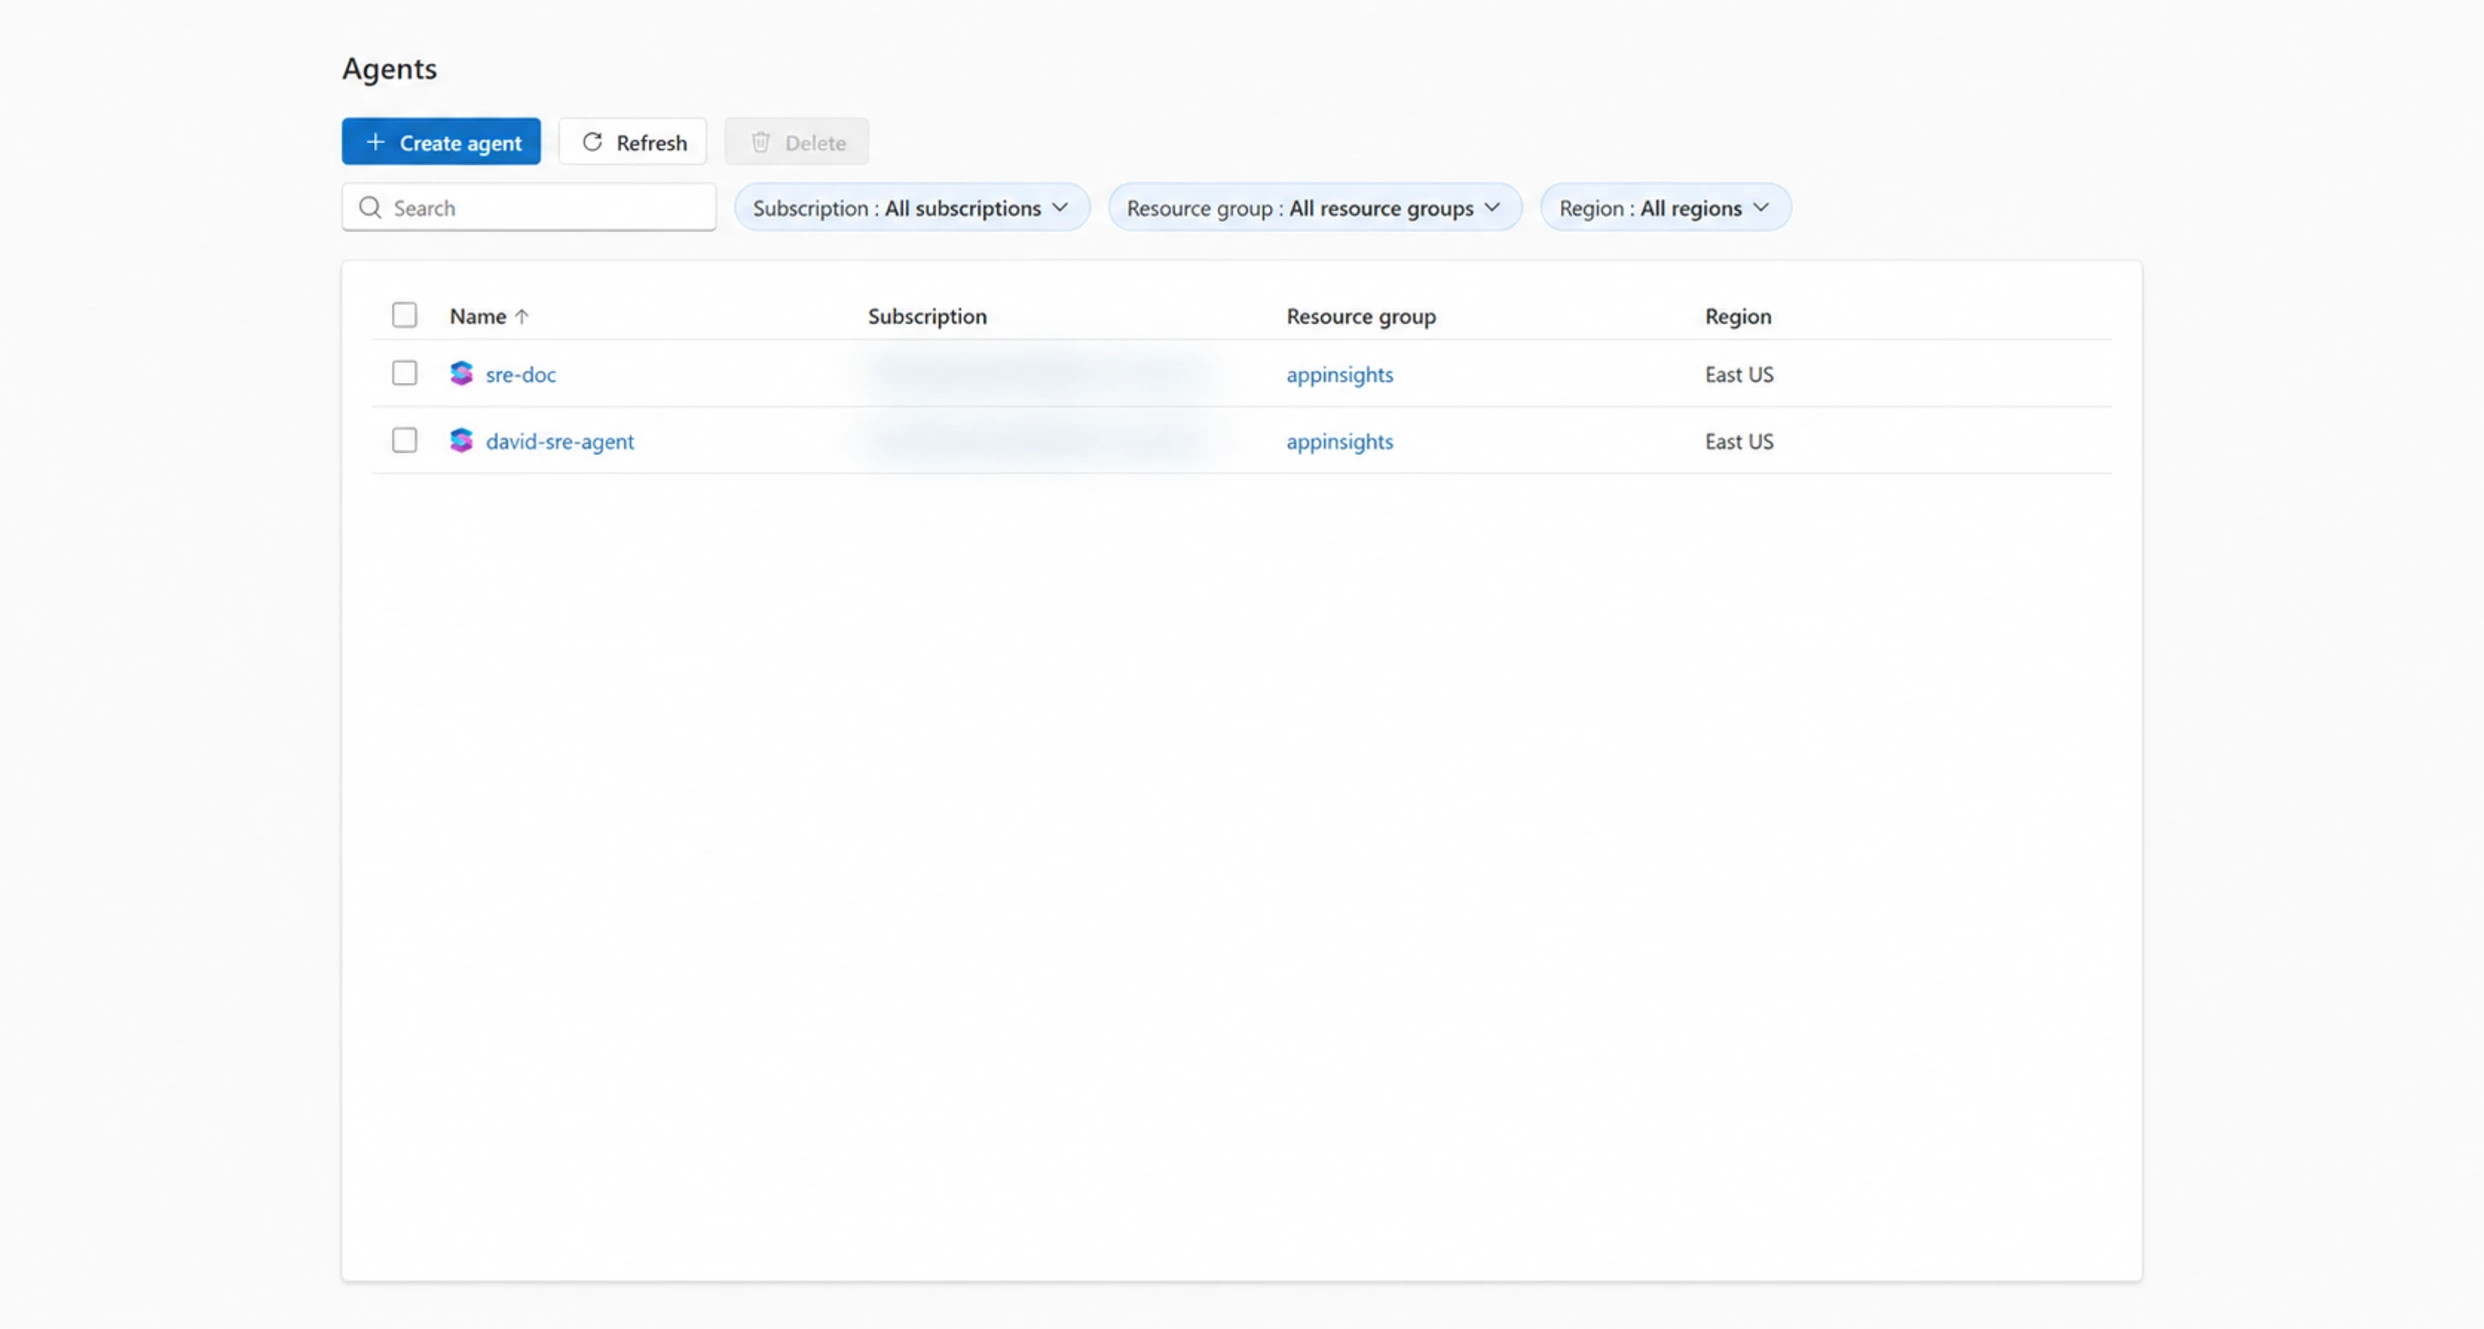
Azure SRE Agent list showing separate agents and their Azure regions
Don’t create a pile of agents just to match your org chart. Splitting one app across several agents spreads out the context each one needs.
Separate agents make sense when there’s a real boundary, like:
data residency
separate access boundaries
separate blast radius
non-production testing versus production
7. The setup checklist
A new agent shows a checklist of which major context sources are connected.
There are five:
Incidents
Knowledge files
Code
Logs
Azure resources
It’s still useful before all five are done. But missing context limits what it can investigate.
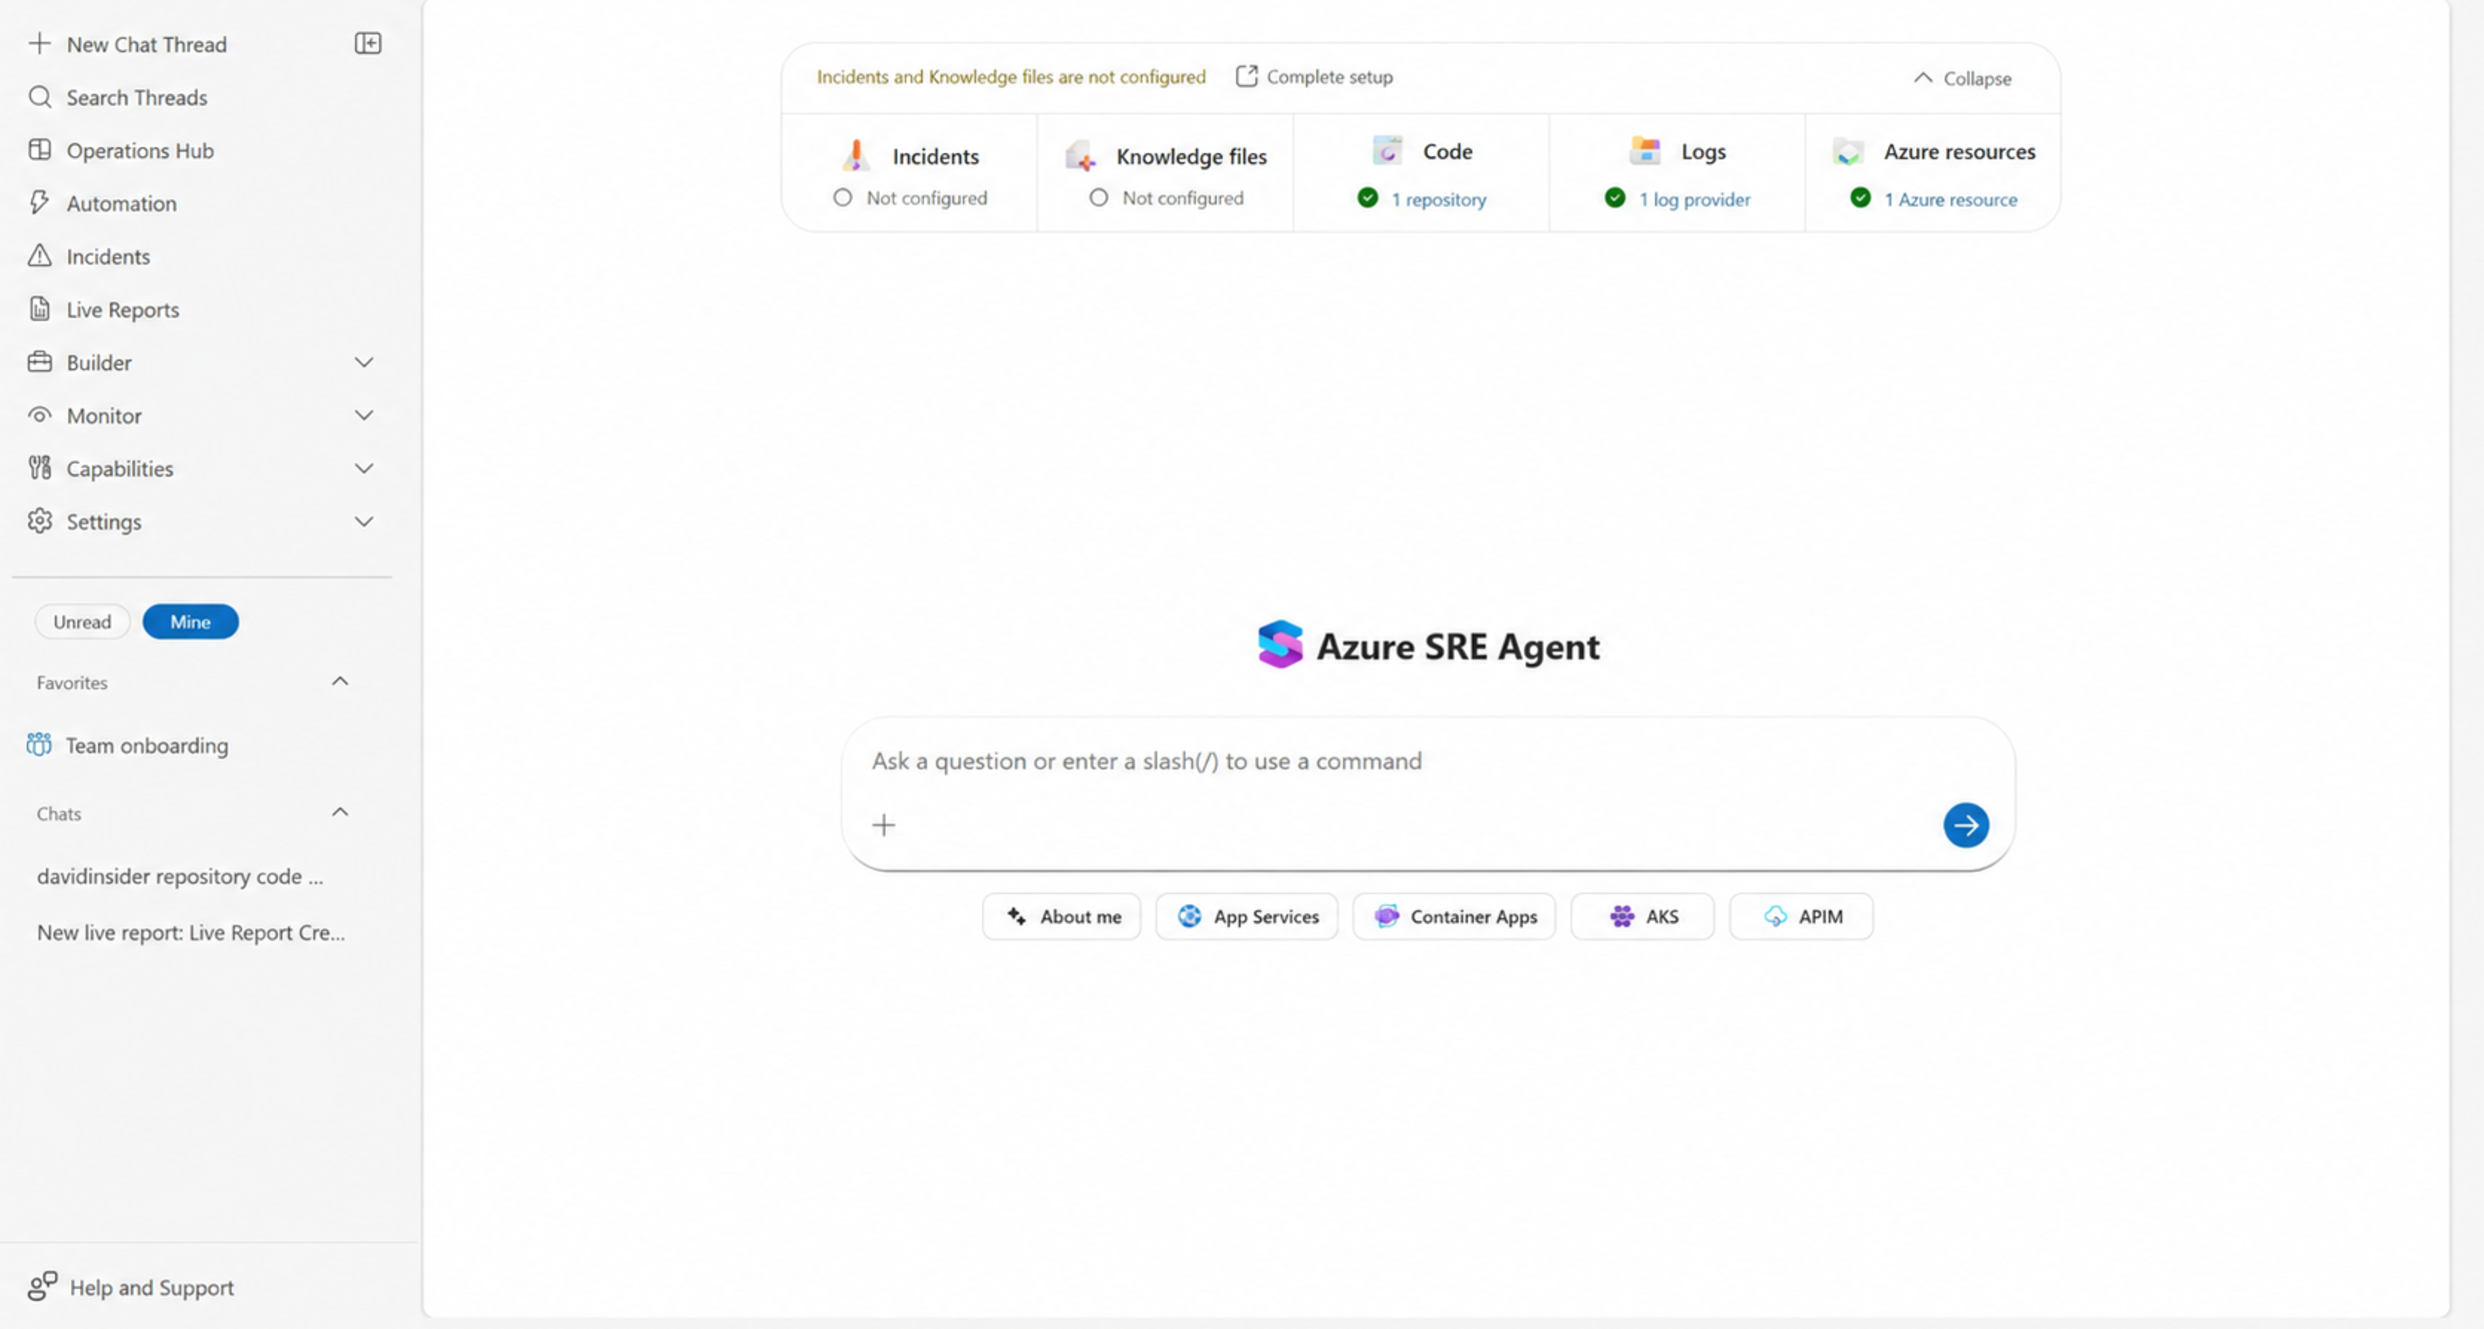
Setup checklist with Incidents and Knowledge unconfigured while Code, Logs, and Azure resources are connected
I like this. It makes gaps obvious so you don’t assume the agent can see something it can’t.
8. Connecting code through Code Access
Repo access lives in Code Access.
You authorize a domain first, like:
github.com
GitHub Enterprise
Azure DevOps
GitLab
Then you add repos under that domain.
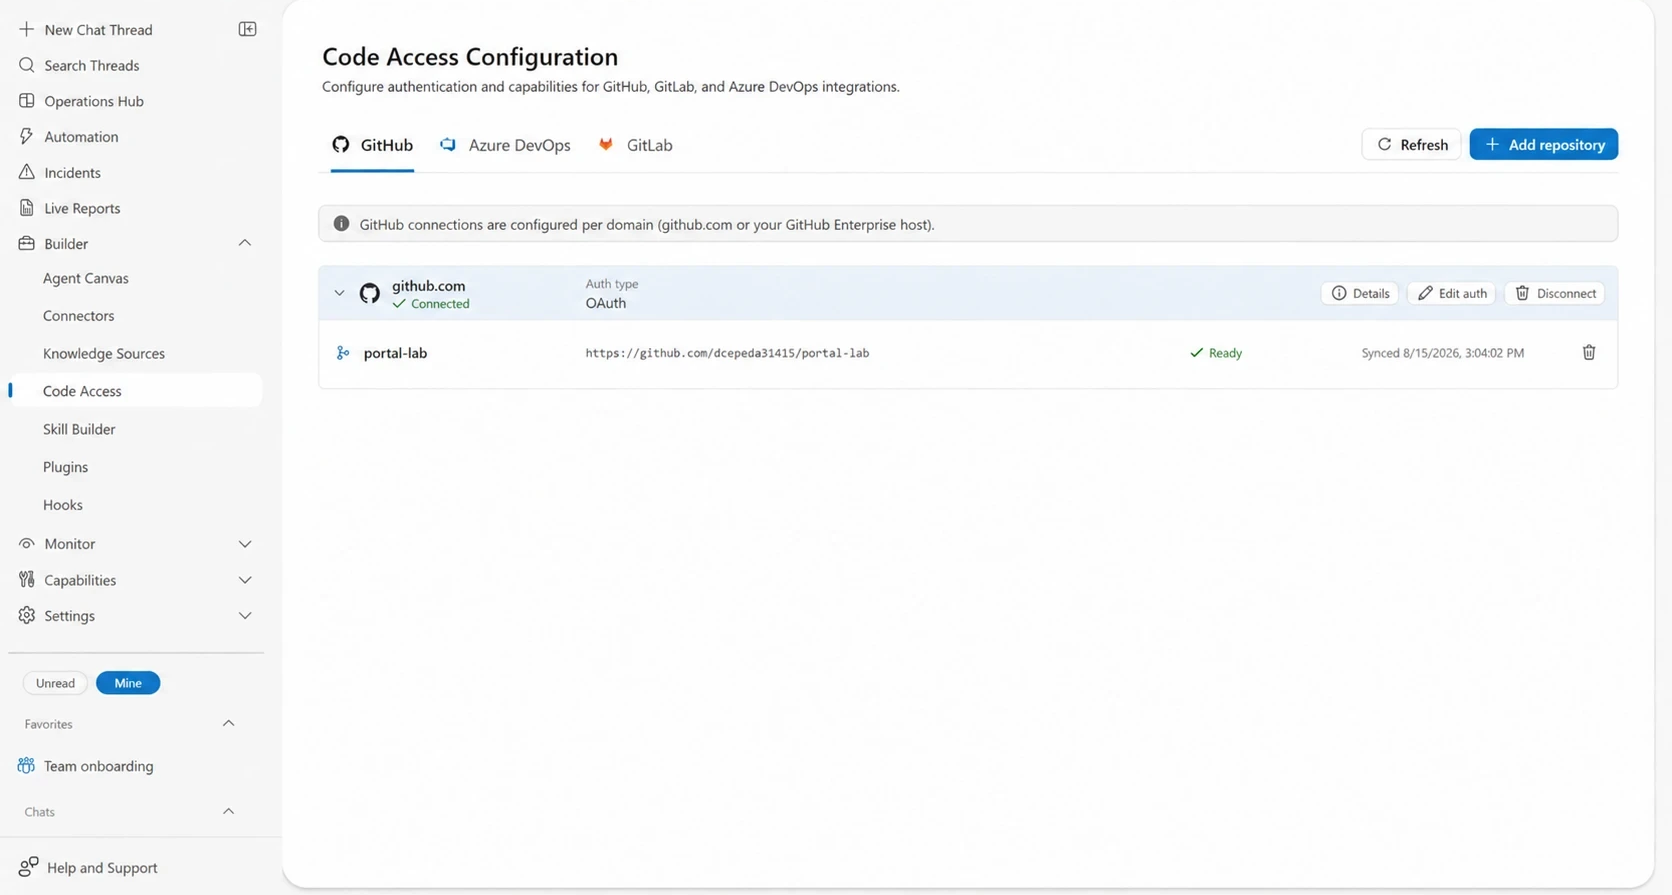
Code Access page with GitHub, Azure DevOps, and GitLab tabs and a synchronized repository
Each synced repo shows a status and timestamp. You can tell how fresh the agent’s copy of the code is.
9. Built-in tool permissions
My agent had 50 built-in tools, with 35 active.
Each tool has:
On / Off
Allow / Ask
They’re grouped into categories like System, DevOps, and Workspace Operations.
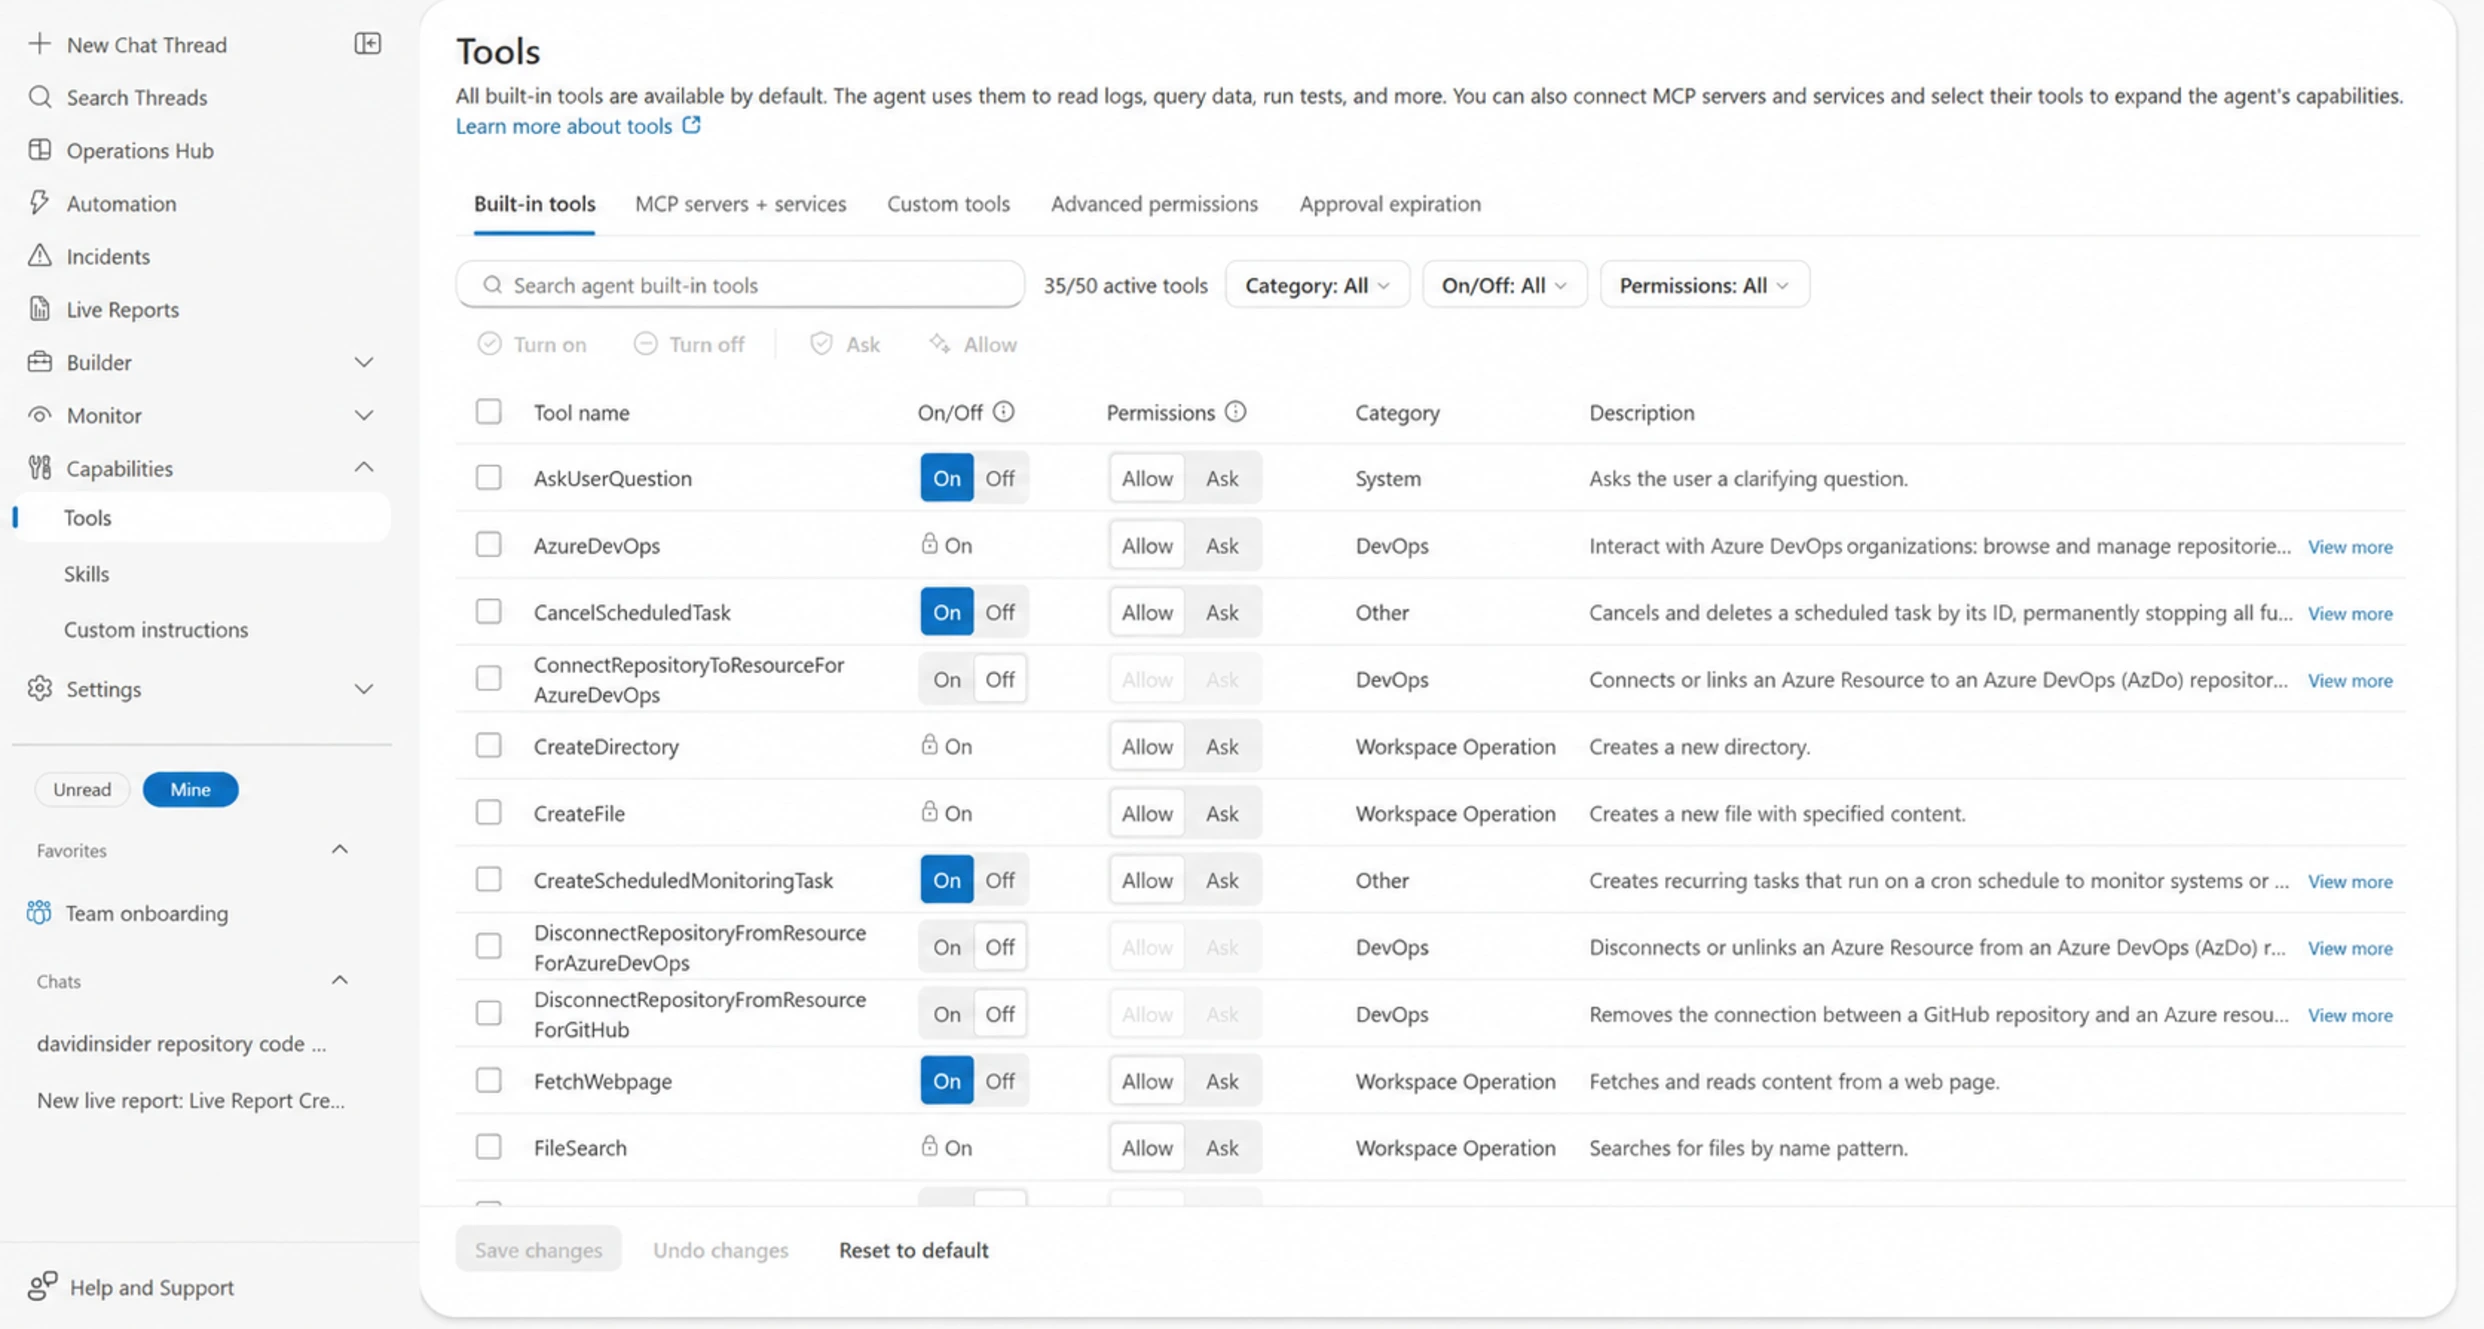
Built-in Tools page showing active tools, categories, and Allow or Ask controls
The Tools page and connector permissions are the two policy screens I’d watch most. They decide what the agent can actually run.
10. The managed identity underneath
Tool permissions don’t grant Azure resource access. The agent’s managed identity does.
There are two identity modes at creation:
Reader
Privileged
Reader gets monitoring and read permissions.
Privileged adds contributor-style roles based on the resource types in the selected resource groups.
Four roles get assigned either way:
Reader
Log Analytics Reader
Monitoring Reader
Monitoring Contributor
The first three go on the selected resource groups. Monitoring Contributor goes at subscription scope so the agent can acknowledge and close Azure Monitor alerts.
If you don’t select any resource groups at creation, the identity gets no resource permissions at all.
I’d start with Reader. A missing permission fails loudly, so you’ll know. When the agent needs something bigger, an Administrator can approve that one operation with an on-behalf-of flow. The agent doesn’t have to become permanently privileged.
11. Tool access policies
There’s another governance layer called tool access policies.
These use patterns instead of single switches.
For example:
bash(az * delete *)
RunKubectlReadCommand(kubectl get *)
Patterns apply at three scopes:
Global
Custom agent
Thread
Here’s how the scopes behave:
Global:
  Administrator
  Allow / Ask / Deny

Custom agent:
  Administrator or author
  Allow only

Thread:
  Any user
  Allow only
Lower scopes can only widen things inside the global boundary. They don’t normally override a global deny.
12. Hooks for context-aware rules
Hooks look at context instead of just matching a tool pattern.
A hook can be:
command hook
prompt hook
A command hook runs a fixed Bash or Python check in a sandbox.
A prompt hook asks a model to make the call.
I found a mismatch. A design guide listed four events:
Start
PreToolUse
PostToolUse
Stop
but the docs I checked only listed:
PostToolUse
Stop
at that time.
That matters. PostToolUse runs after the tool already ran. To actually stop a destructive command, you need a deny policy, not a hook that fires afterward.
Hooks also had the highest precedence in the documented model. An Administrator’s hook could allow something a policy would deny. So Administrator access to hooks is part of your real security boundary.
13. Restricting network egress
Tool permissions control what the agent can do. They don’t control where its traffic goes.
By default it had open public internet access. That may not be okay for an agent with production access.
When I tested, VNet integration was in preview.
The networking page had three modes:
Unrestricted
Limited
Azure VNet
Unrestricted allows general outbound access.
Limited denies by default and lets you allow specific hosts.
Azure VNet sends non-platform traffic through a delegated subnet where normal network controls apply.
That brings the agent under:
NSGs
firewall rules
custom DNS
network logging
private endpoints
VPN / ExpressRoute reachability
14. Setting up the VNet subnet
The delegated subnet has to:
be dedicated
be in the same region as the agent
be delegated to Microsoft.App/environments
That’s the Azure Container Apps delegation.
You also need permission like:
Microsoft.Network/virtualNetworks/subnets/join/action
plus SRE Agent Administrator on the agent.
The docs said /28 or larger and recommended /26 for fleets. Another announcement used /27. I’d go with /27 as a middle ground for a setup like mine.
Once VNet mode is connected, you have to disconnect before switching modes or picking a different subnet.
15. Linking Private DNS zones
VNet access alone isn’t enough for Private Link resources.
You need Private DNS zone links like:
privatelink.ods.opinsights.azure.com
privatelink.vaultcore.azure.net
If the zone isn’t linked to the VNet, the agent might not resolve the private endpoint. Or it might quietly use a public route if one still exists.
Here’s the catch. The agent keeps investigating even after a network call fails. So an answer can sound complete while missing evidence.
Read the tool failures, not just the final findings.
16. VNet bypass options
Some platform traffic stays on Microsoft-managed infrastructure no matter which VNet mode you pick.
There are also toggles for things like:
package registries
code repositories
remote MCP servers
additional hostnames
Traffic through those bypasses skips your VNet controls.
I’d treat these as temporary shortcuts, not permanent design. Preinstall packages where you can. Use Azure Policy to stop people from casually opening up network access.
17. Running a code review
My first big test was pointing the CodeReview agent at a project repo.
I expected normal security findings. It went further:
security
performance
accessibility
UX consistency
dependency risk
logging hygiene
It split the work across several subagents and then pulled the results together.
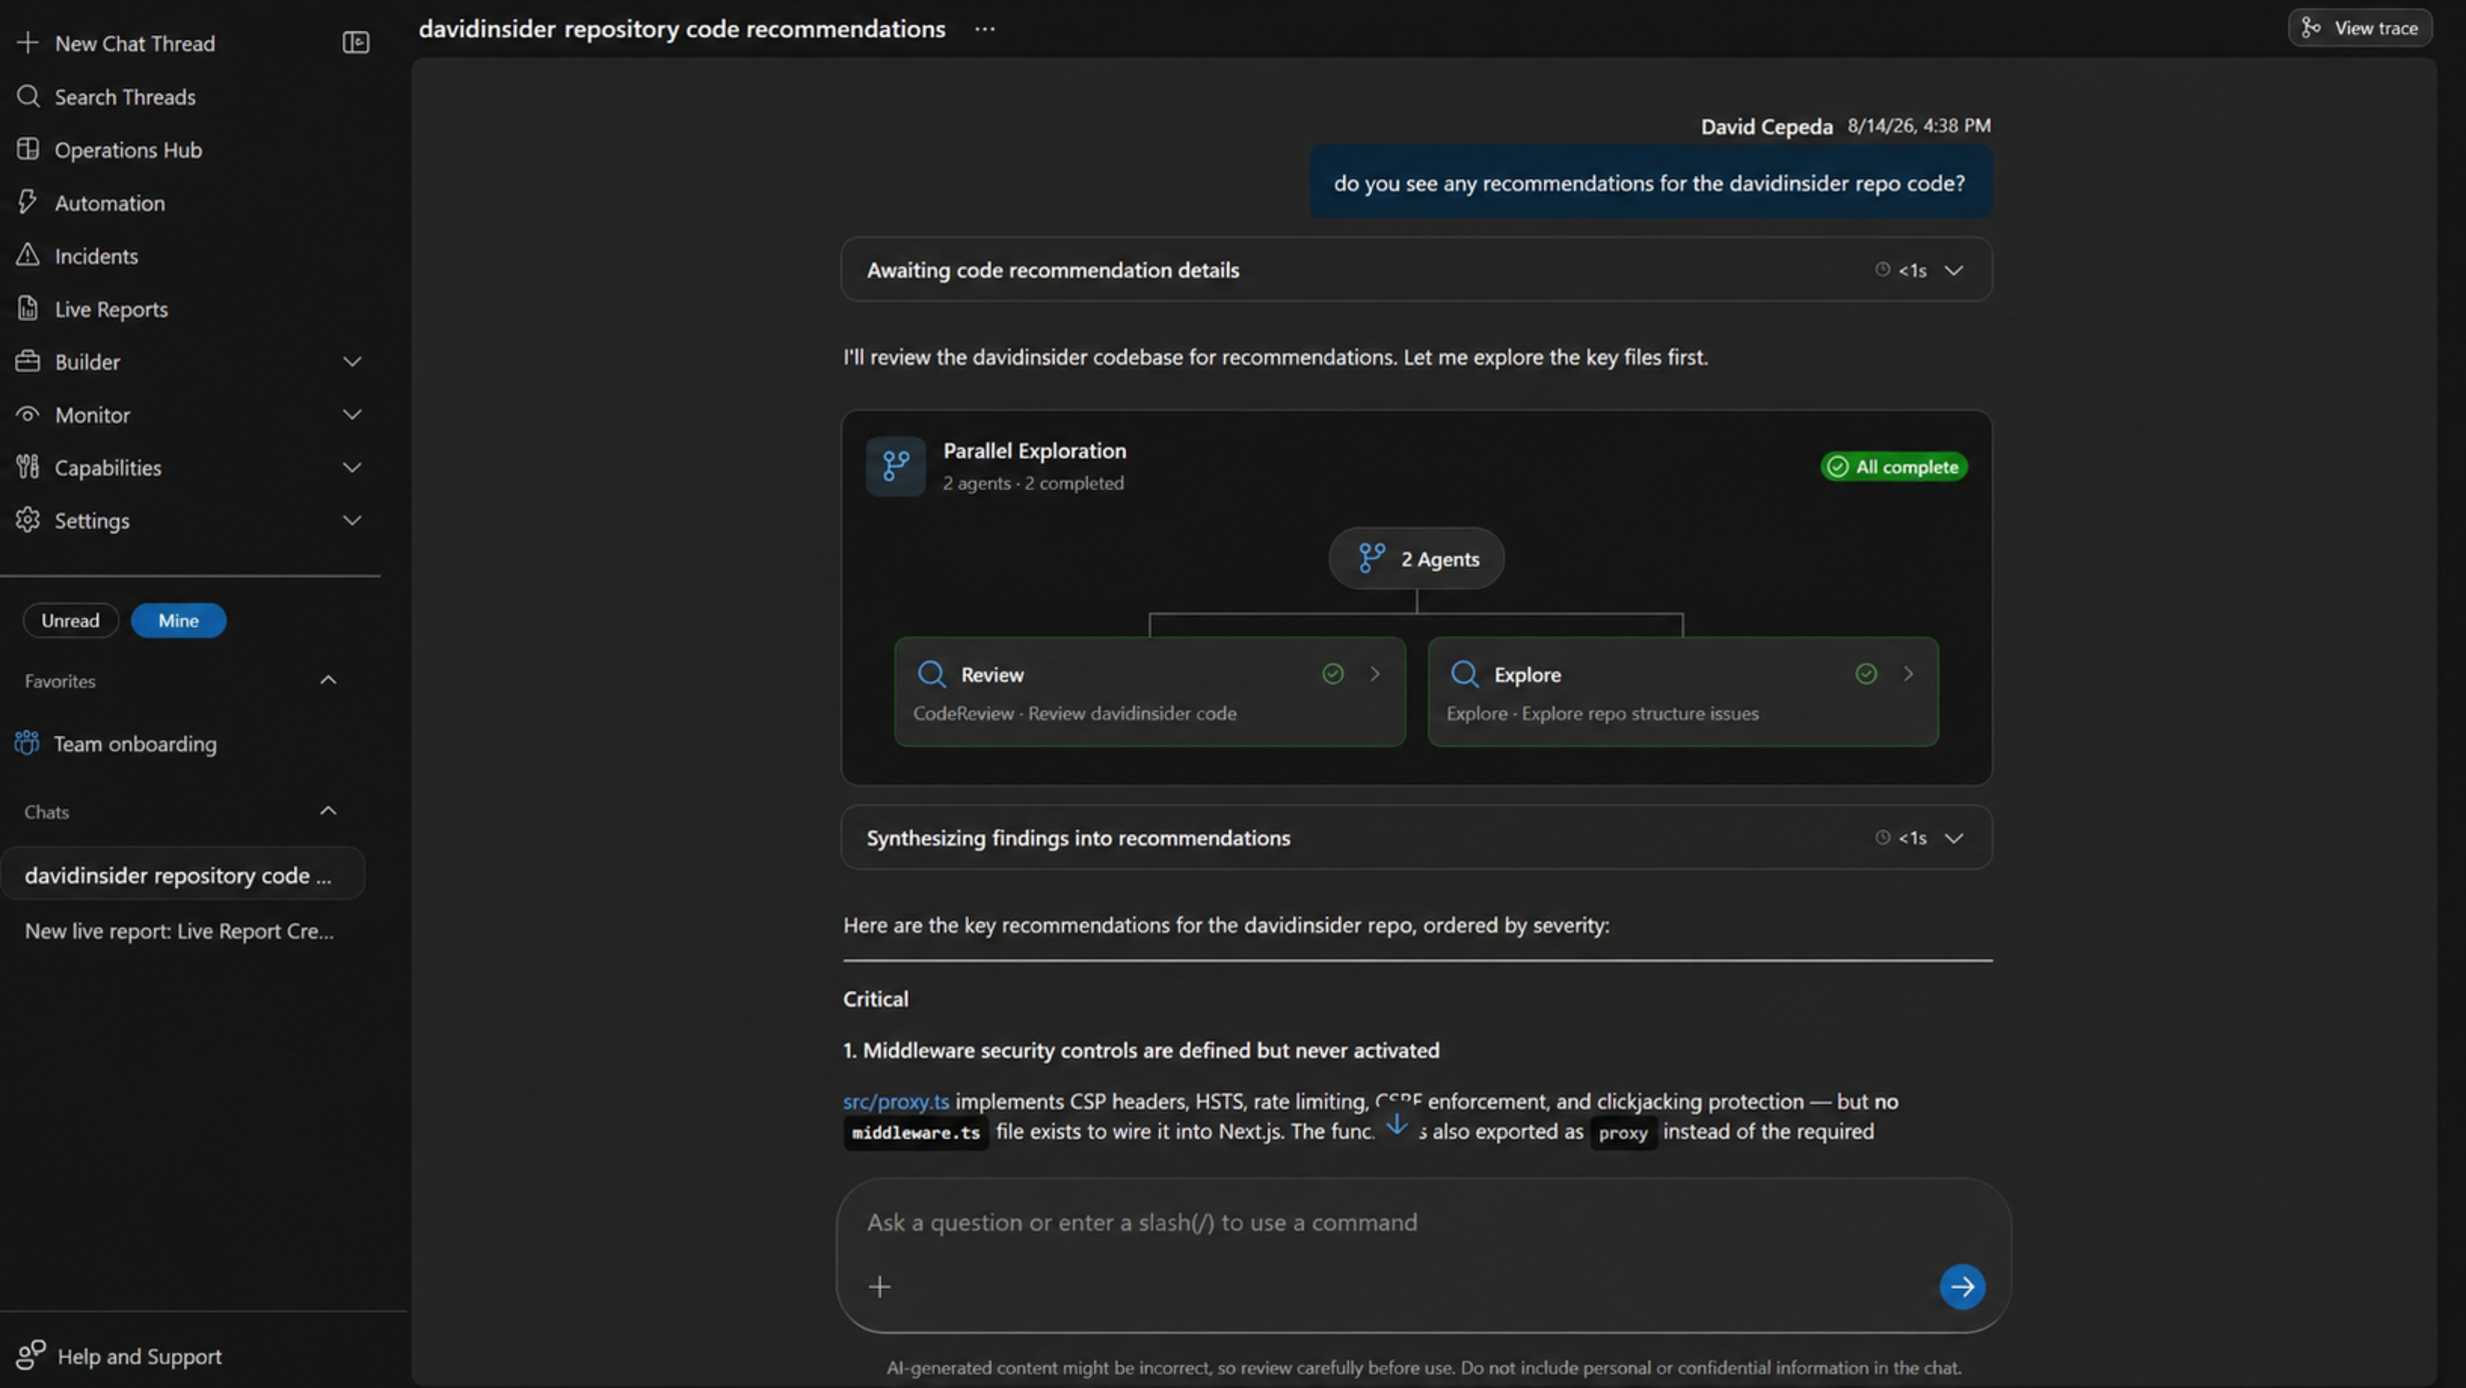
Code review thread showing multiple subagents selected automatically
A CodeReview subagent did the review while an Explore subagent mapped the repo.
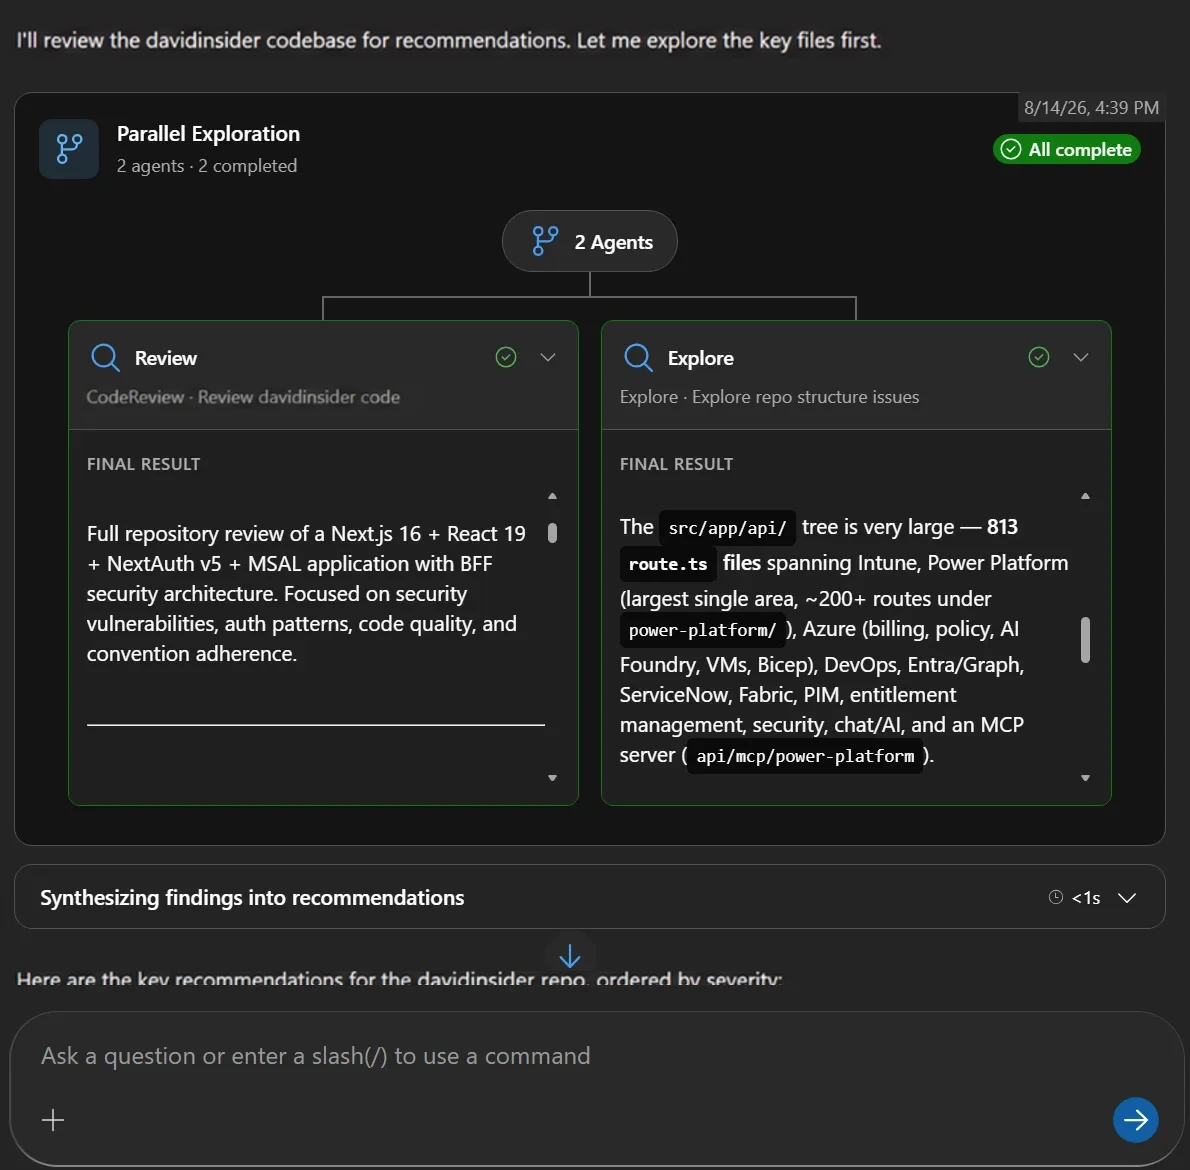
Parallel exploration showing separate CodeReview and Explore results
It found things like:
a pre-release next-auth dependency
unguarded console.log calls
partial API keys and decoded claims reaching production logs
hard-coded chart colors bypassing existing theme tokens
performance issues in large-result pagination
an accessibility gap in a custom form control
inconsistent UX messaging for the same failure
Findings were ranked by severity and pointed to real files and lines.
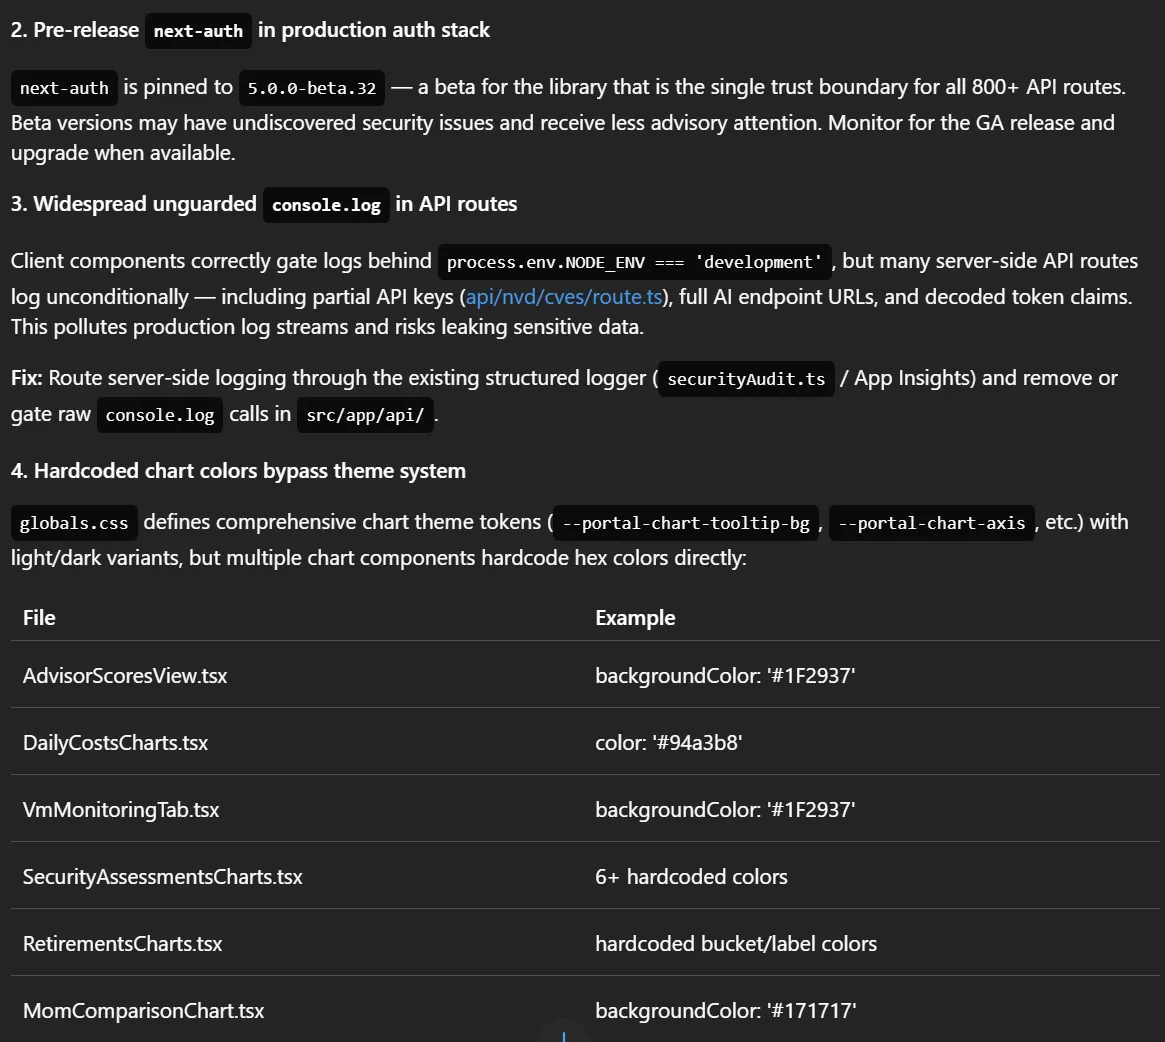
Code review findings with file locations and suggested remediations
It doesn’t replace human review. But for a small team it catches several kinds of issues much earlier.
18. Querying telemetry across apps
My second test connected Application Insights from several workloads.
I had telemetry from:
Dataverse
Copilot Studio
application servers
a Microsoft Foundry-hosted agent
Instead of opening each Application Insights blade, the agent queried requests, dependencies, and exceptions across all of them.
It found:
increasing latency on an app server
elevated exceptions from a Copilot Studio agent
an unreliable dependency call from a Foundry agent
and used recent changes to decide where to look first.
That’s the difference between monitoring and triage. It didn’t just say something was off. It gave me a real place to start.
19. A full health check
Next I gave it a broad prompt on purpose. I asked for:
Azure resource inventory
24-hour Application Insights review
unhealthy resources
investigation priorities
It took 147 seconds.
While it ran, the UI showed the actual commands and queries. That included Azure Resource Graph calls and KQL against requests, dependencies, and exceptions.
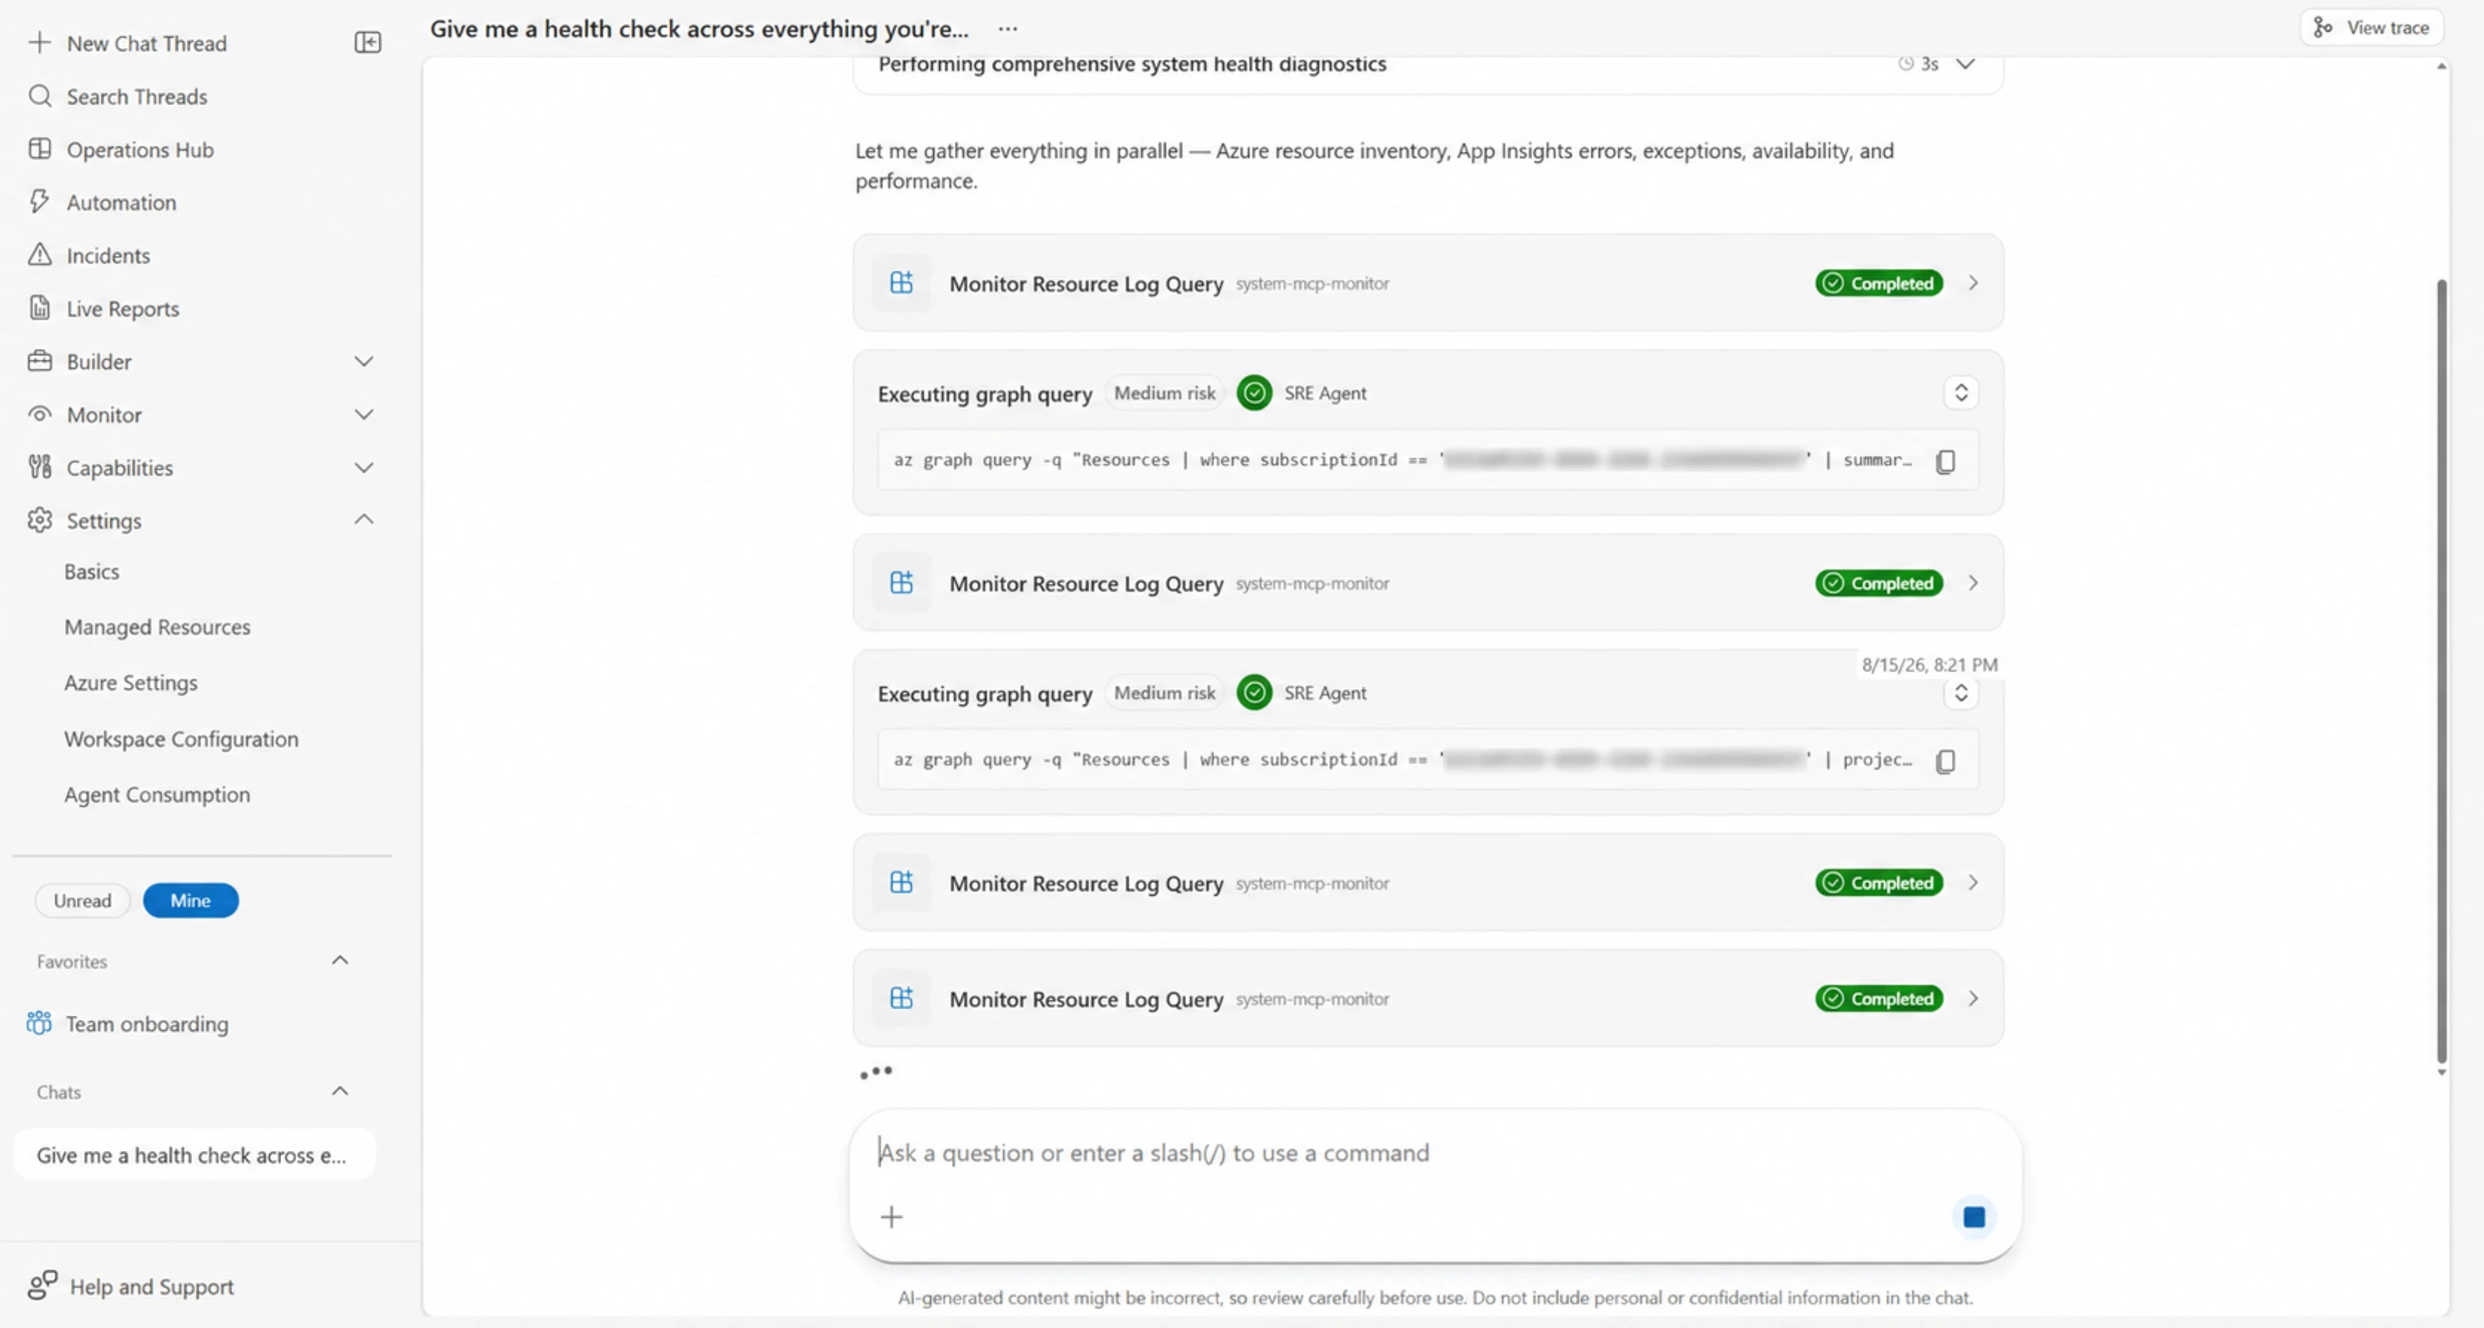
Health-check investigation in progress with visible Azure and KQL queries
The inventory reported, among other things:
13 VMs deallocated
7 of 10 web apps stopped
some stopped apps still targeted by alert rules
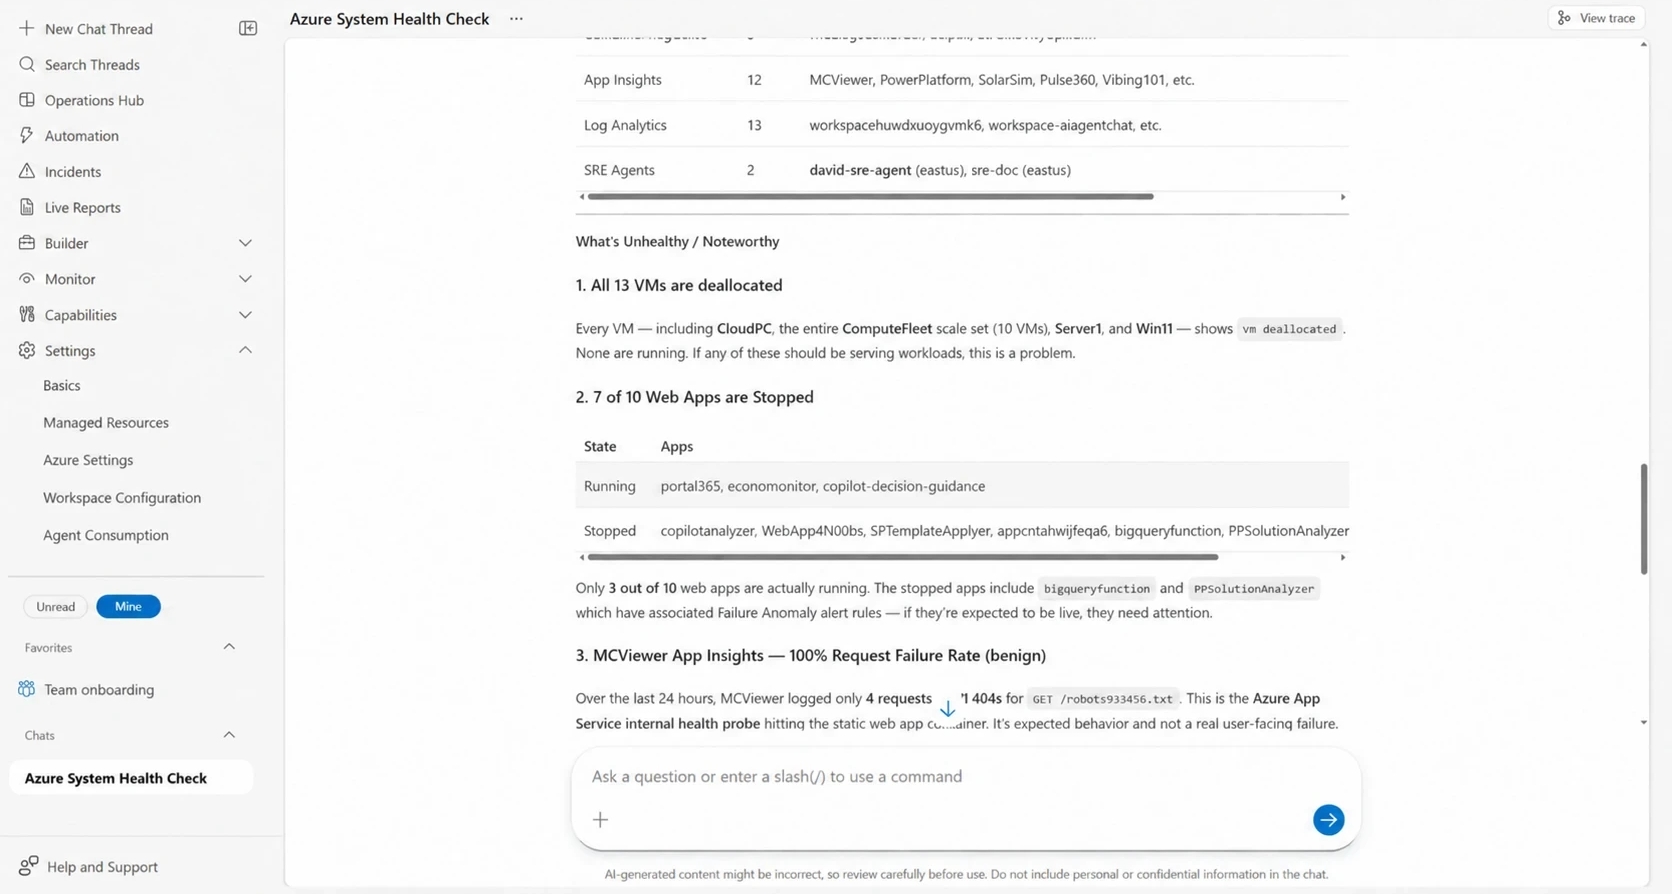
Health-check findings listing stopped resources and telemetry issues
One Application Insights resource showed a 100% failure rate. But there were only four requests, all to:
GET /robots933456.txt
That’s an App Service internal probe. It isn’t a real app failure.
The bigger finding was the lack of real telemetry. If an important service shows almost no requests, ask whether nobody uses it or whether instrumentation is missing.
It finished with a P1-P4 priority table and a separate list of healthy resources.
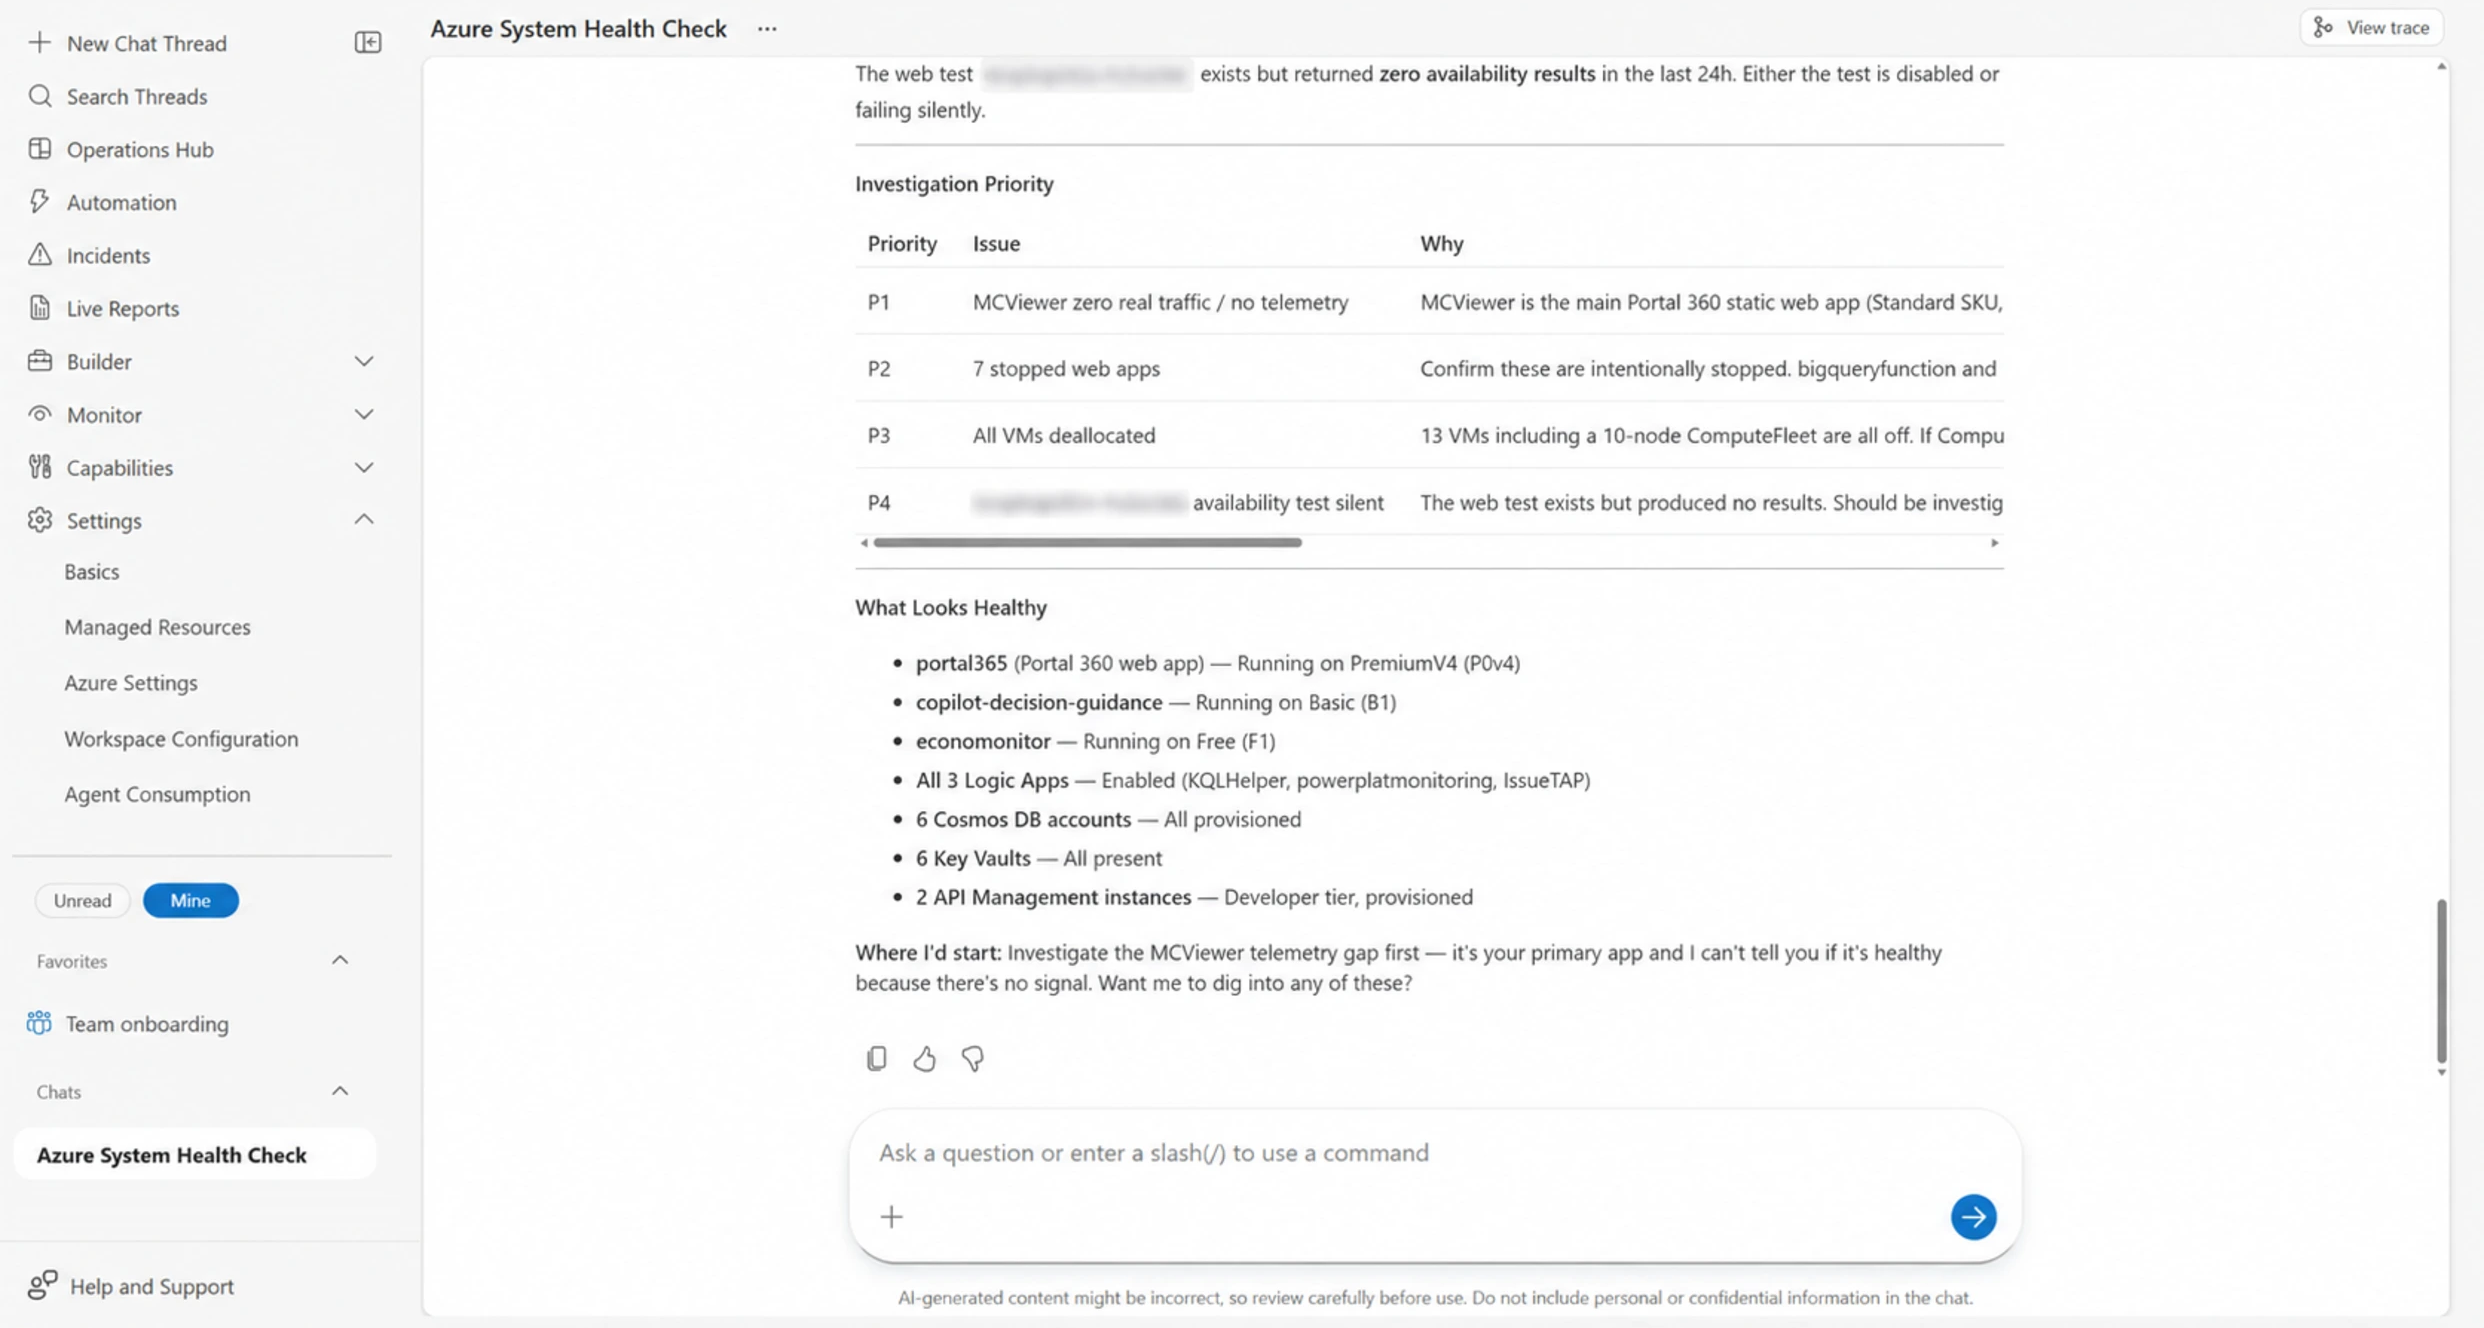
Priority table ranking findings from P1 through P4 with reasons
My favorite part was that it put fixing the telemetry gap first. It didn’t hand me a false all-clear.
20. Live Reports from chat
Live Reports are dashboards you build by chatting.
You describe the report, the agent builds it, and it pulls live data when you open it.
Reports are versioned and link back to the thread that made them.
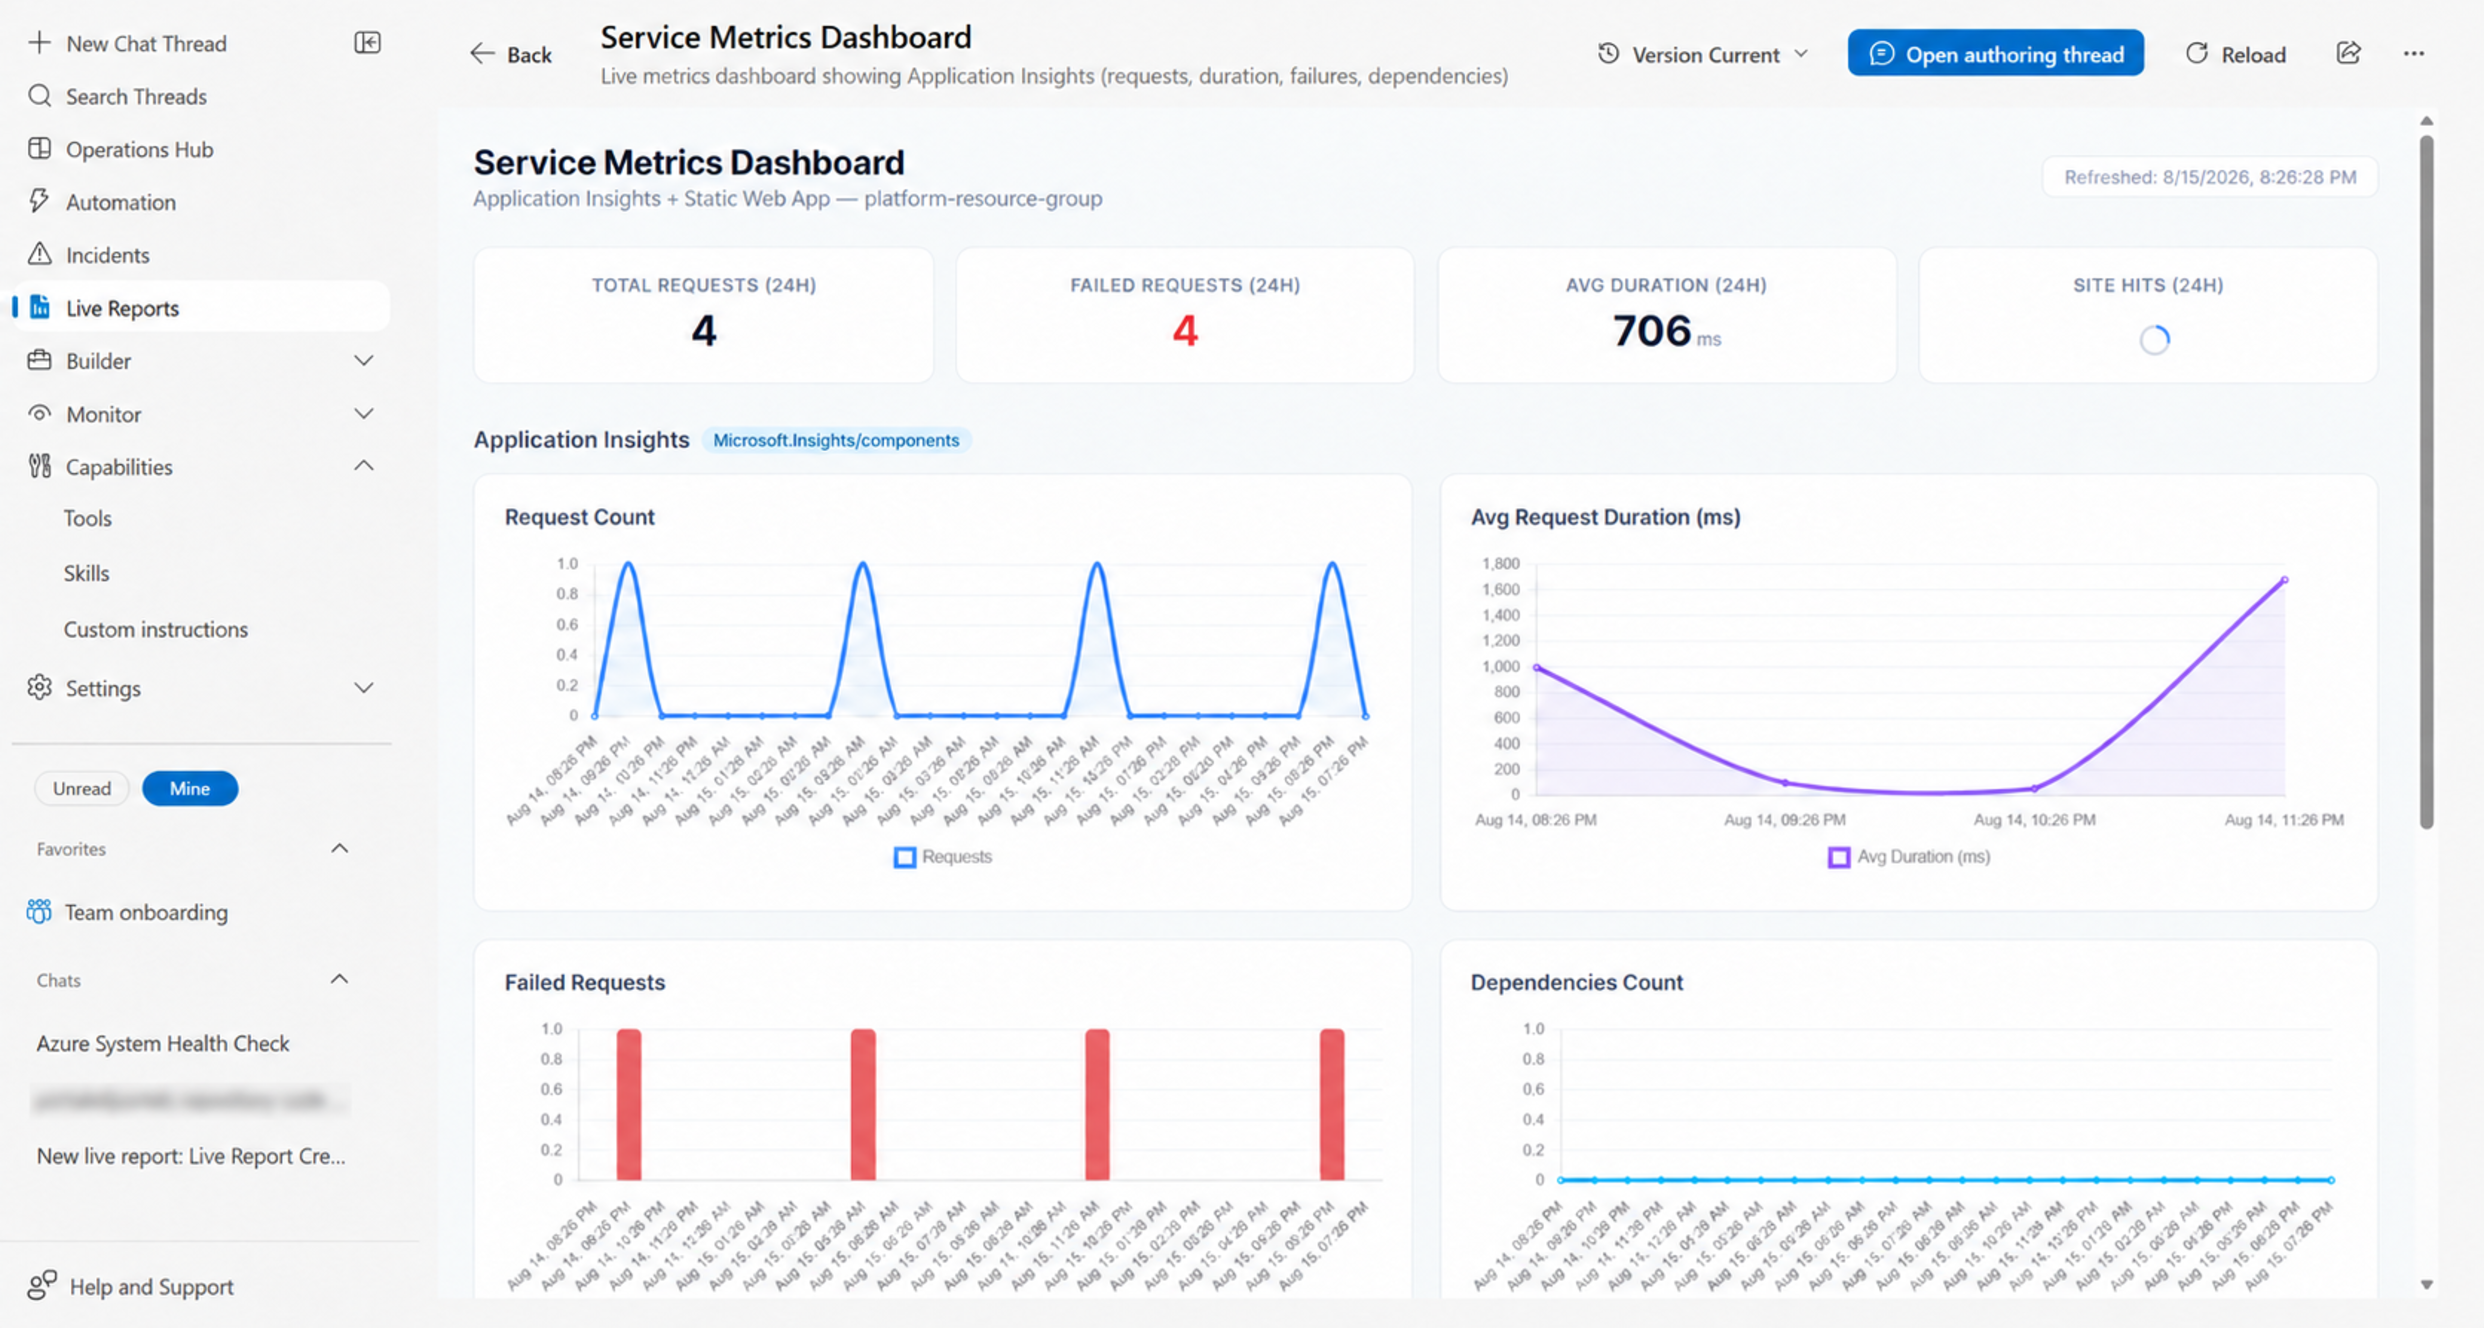
Live Report dashboard created through an Azure SRE Agent conversation
That link is handy. If a chart doesn’t make sense later, you can go back to the original conversation.
21. Connecting an incident platform
I didn’t have an incident platform connected. Here’s what you’d get by adding one.
Without it, the agent can still:
answer interactive questions
run scheduled work
run HTTP-triggered automations
but it won’t get an incident queue automatically.
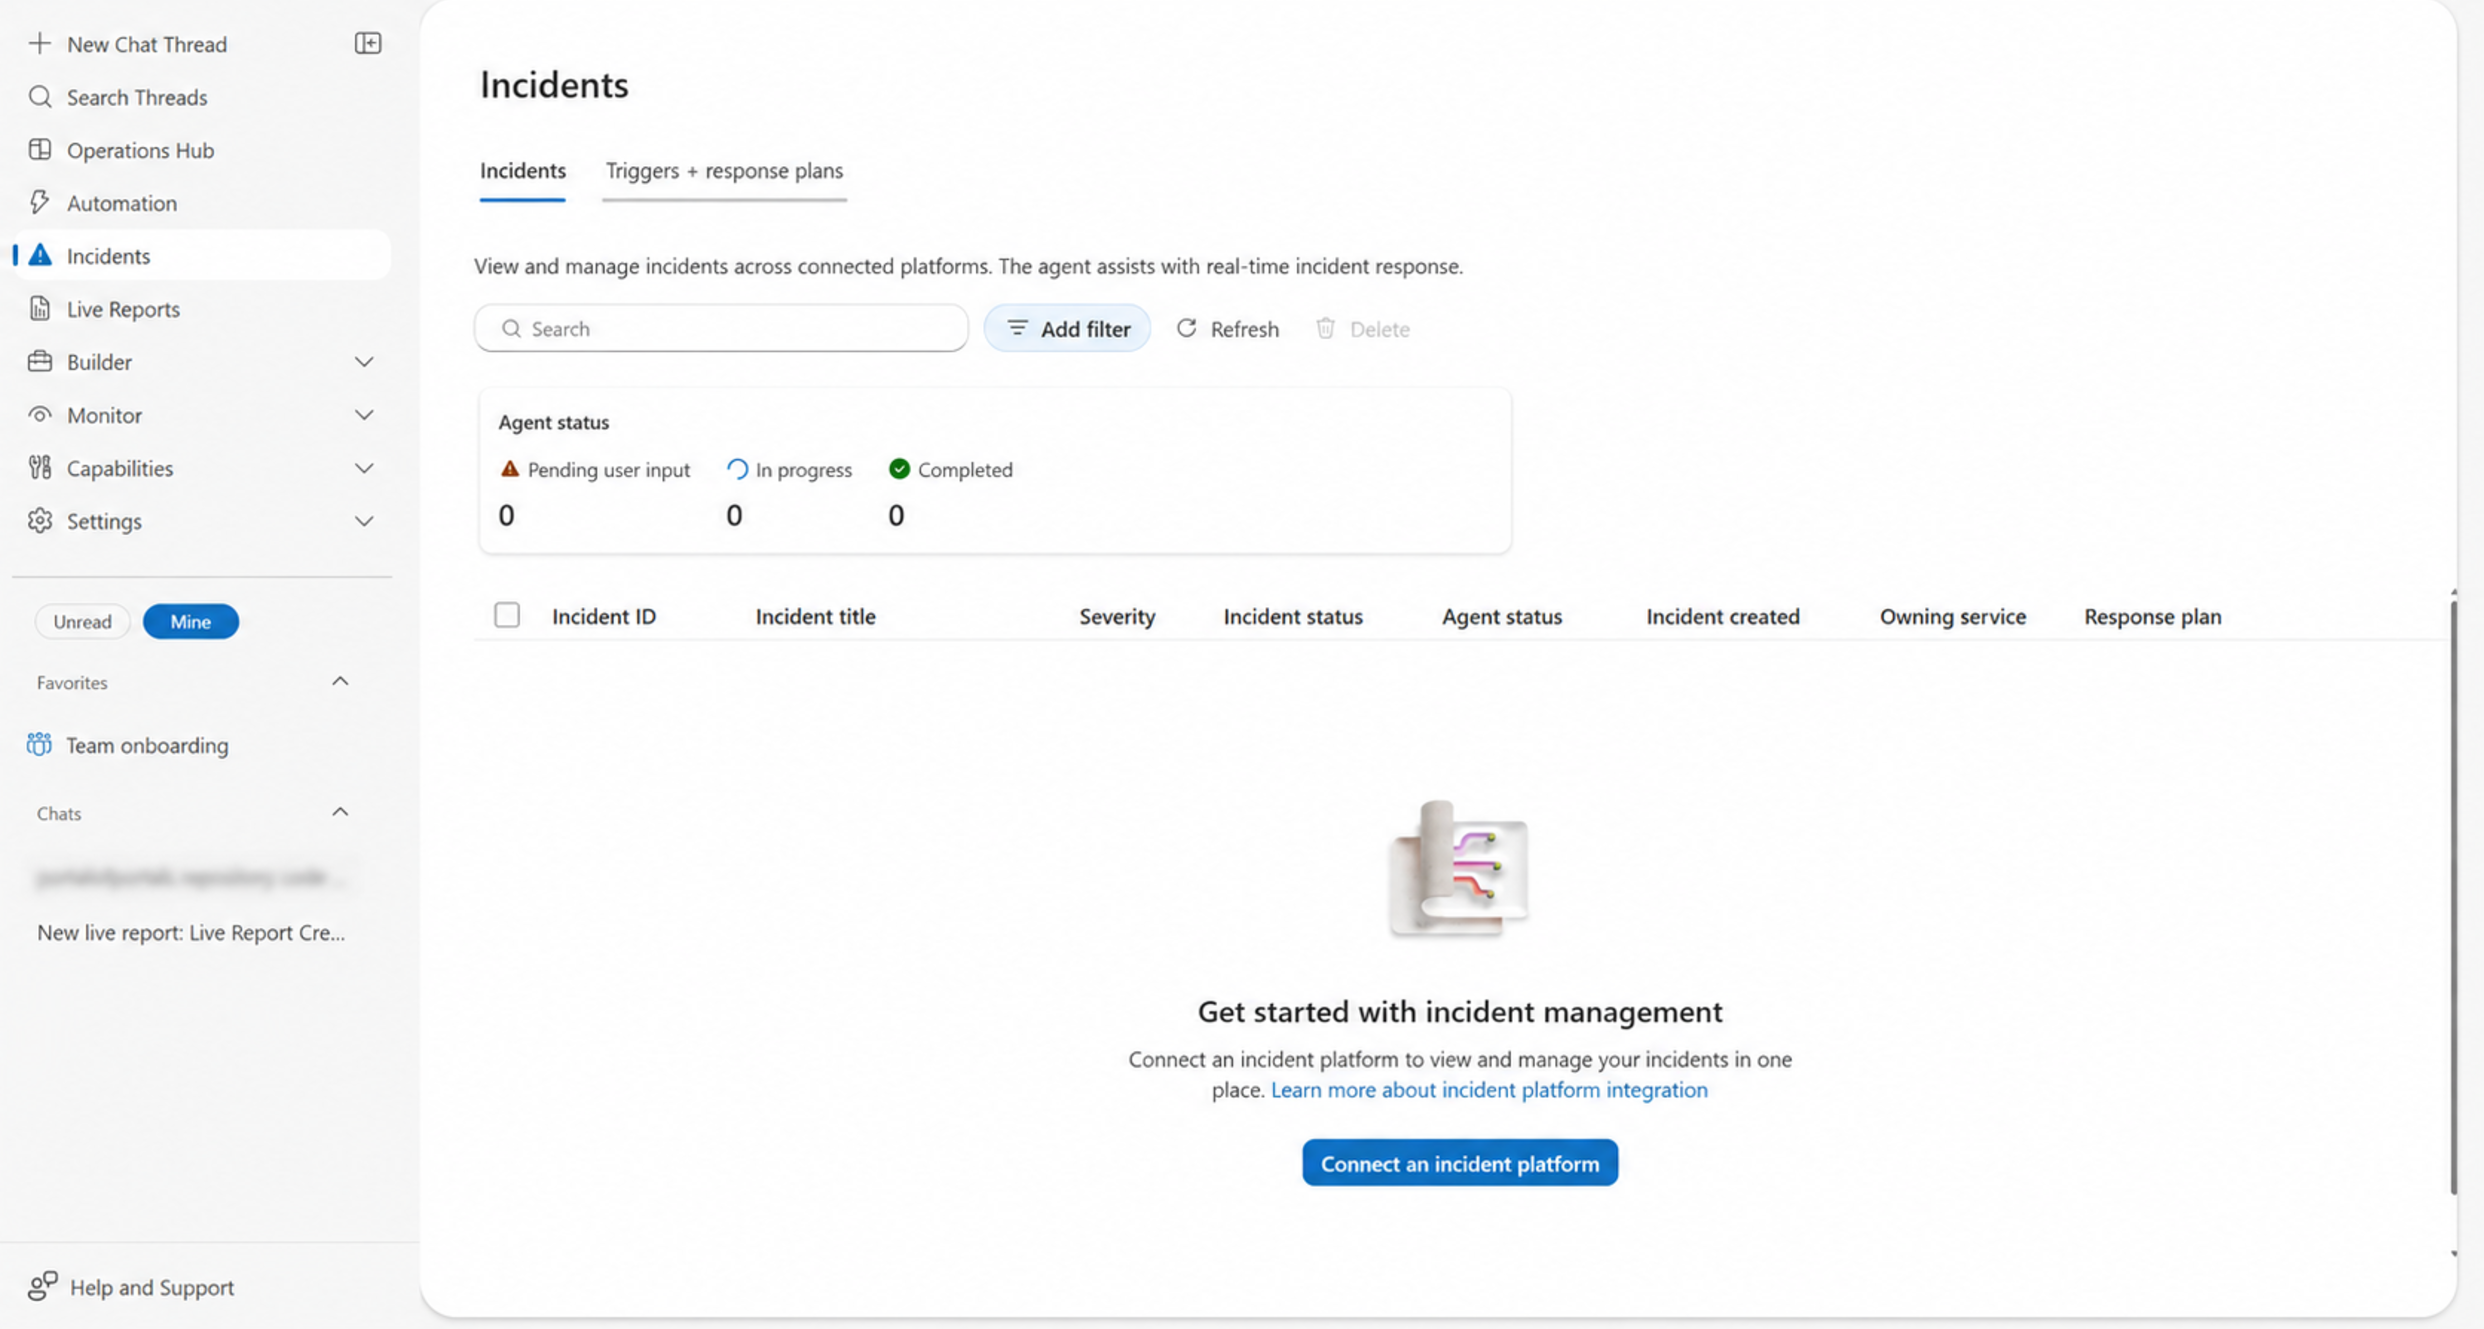
Incidents blade before an incident platform is connected
I watched an Azure Friday demo that used ServiceNow. In that demo:
ServiceNow incident is raised
SRE Agent starts investigating
metrics and logs are correlated
a response plan is executed
the application is scaled
recovery is verified
the incident is updated
root cause is pushed toward engineering work
To be clear, I watched this demo. I didn’t run that workflow myself.
22. Custom agents and skills
Agent Canvas is where you build custom subagents and reusable skills.
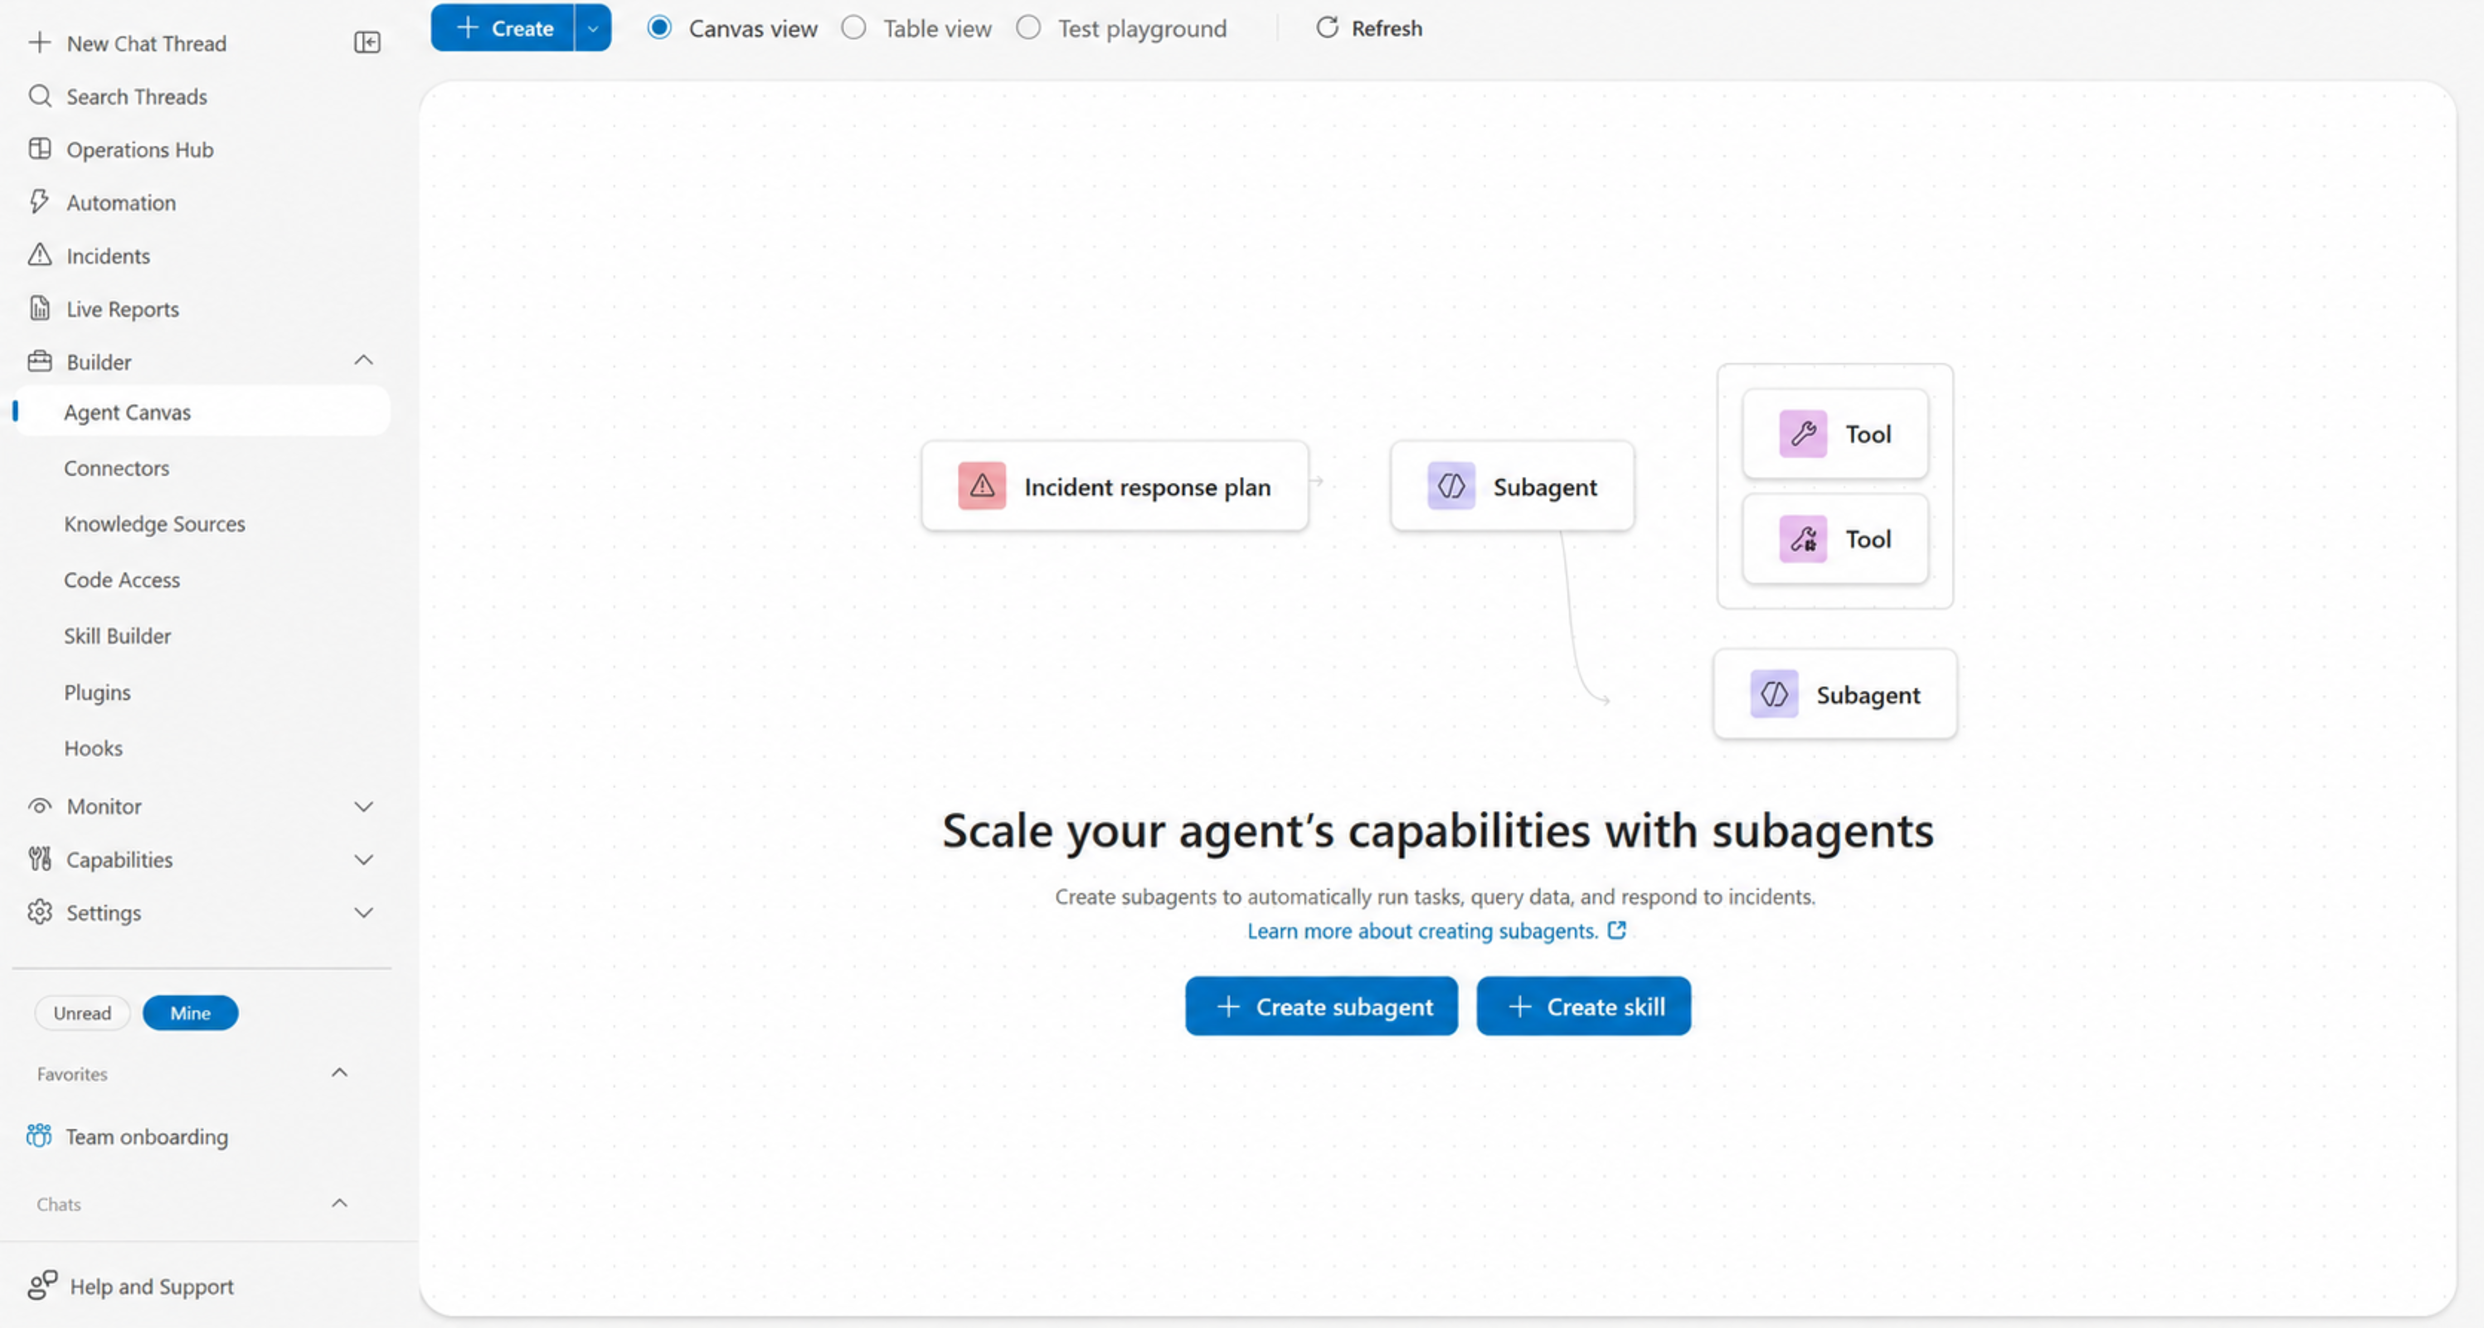
Agent Canvas for creating custom subagents and skills
A custom agent can have:
its own instructions
its own knowledge
its own tools
its own operational scope
My test subagent inherited 212 tools from its parent.
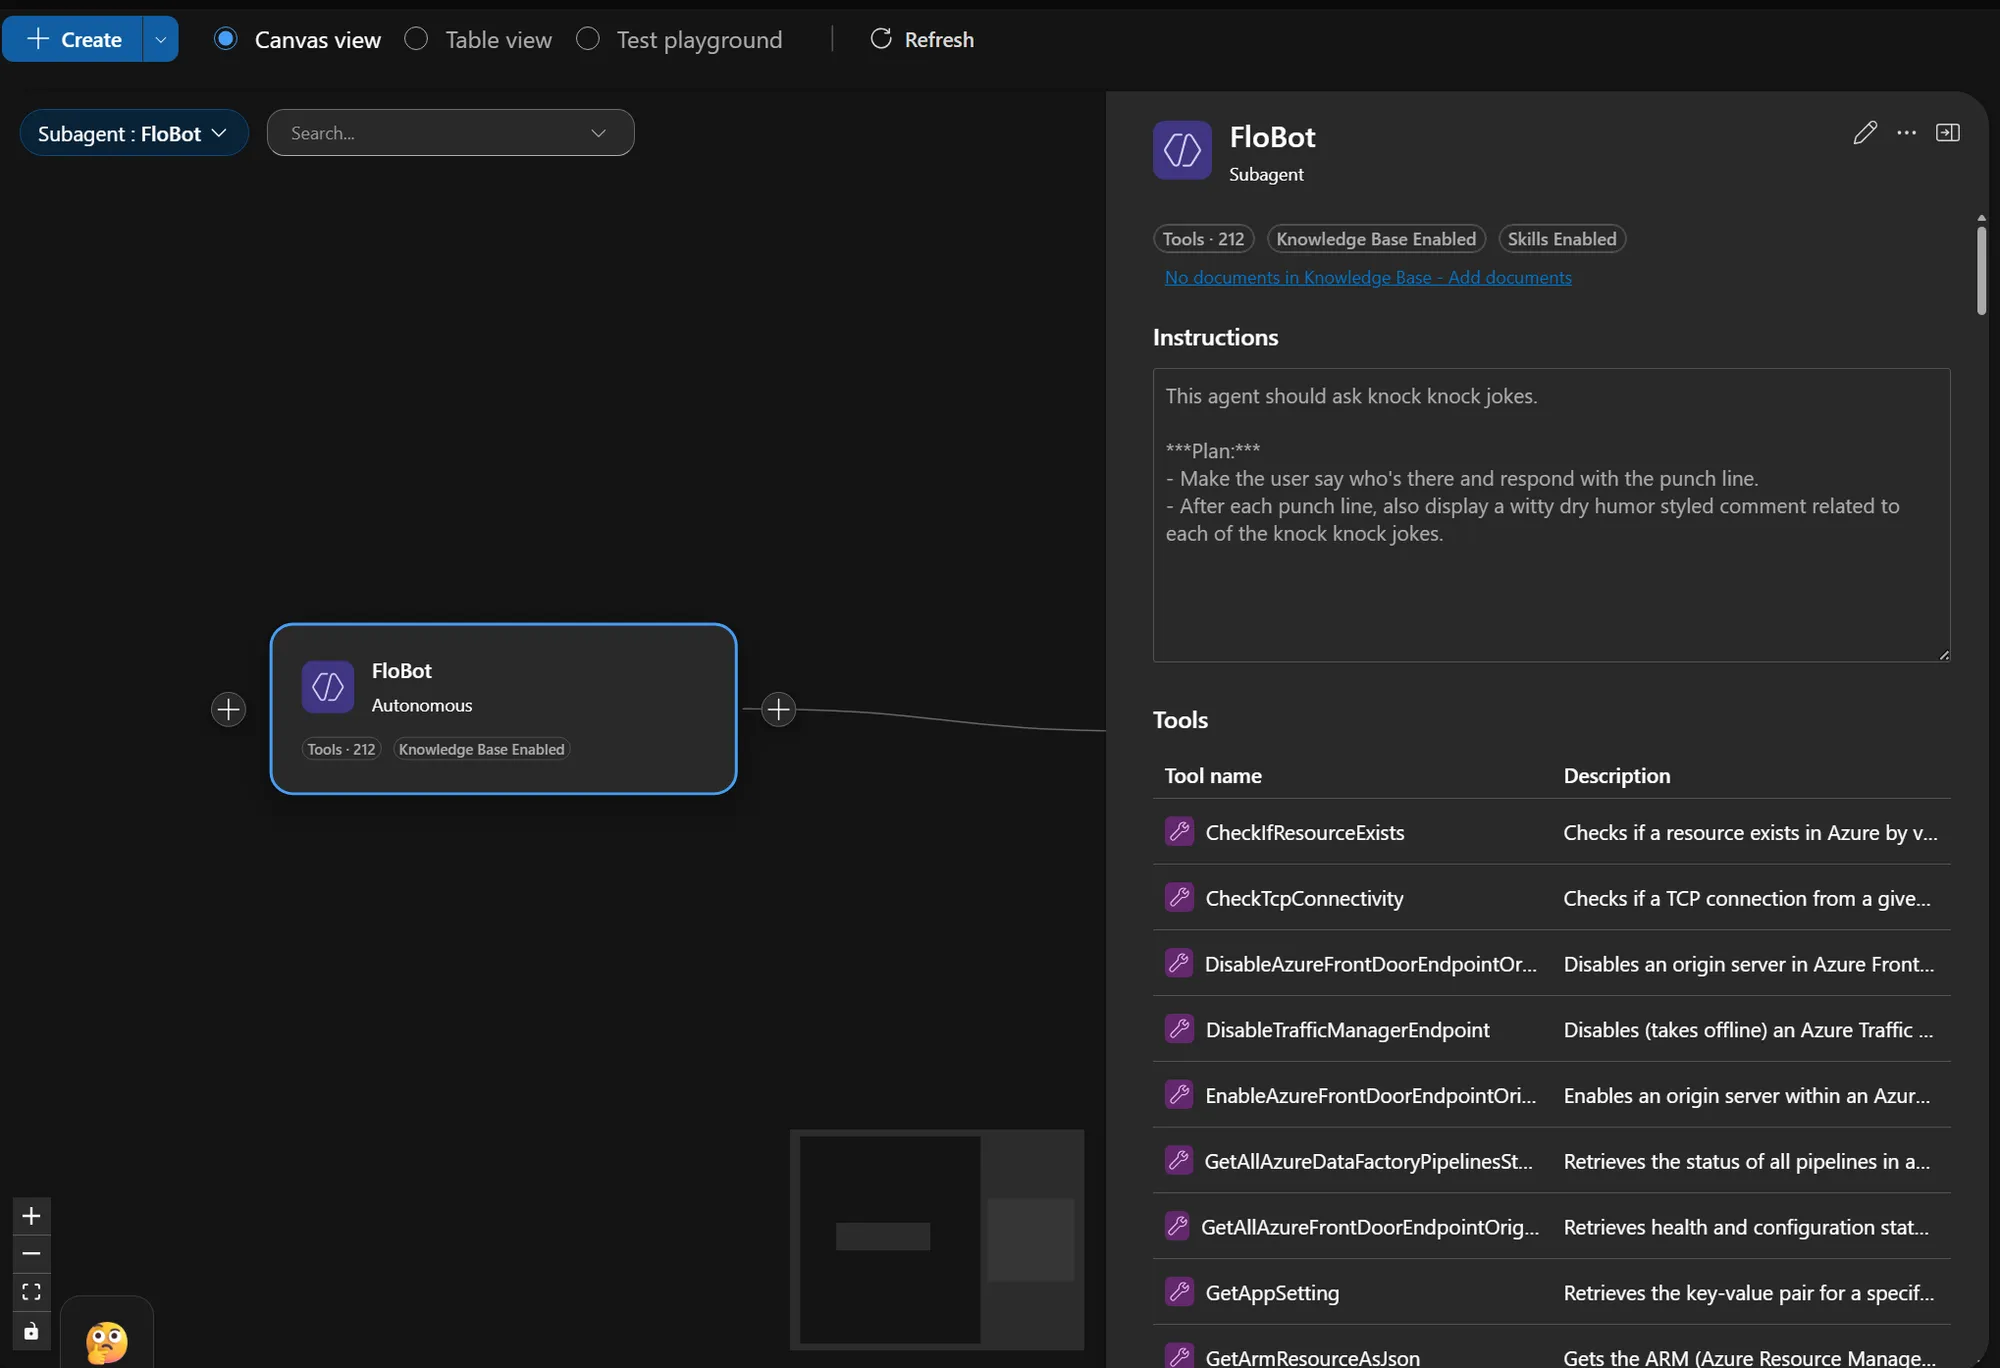
Custom subagent with instructions, knowledge, and inherited tool access
Here’s the difference:
Custom agent = what specialist is doing the work
Skill        = how a repeatable procedure is executed
Don’t invent these from scratch. Turn an existing runbook into a skill and review it. Or solve a real incident with the agent, then ask it to turn what worked into a skill.
23. Response plans
A response plan defines how to handle a type of incident.
You can write it in plain language or paste in a runbook. The agent turns it into a structured plan with tools on each step.
Autonomy is set per plan.
So one incident type can stay fully human-controlled while another runs on its own.
24. The full incident loop
The ServiceNow demo starts with a food ordering app where Add to cart begins failing.
The incident system raises a ticket and the agent starts investigating automatically.
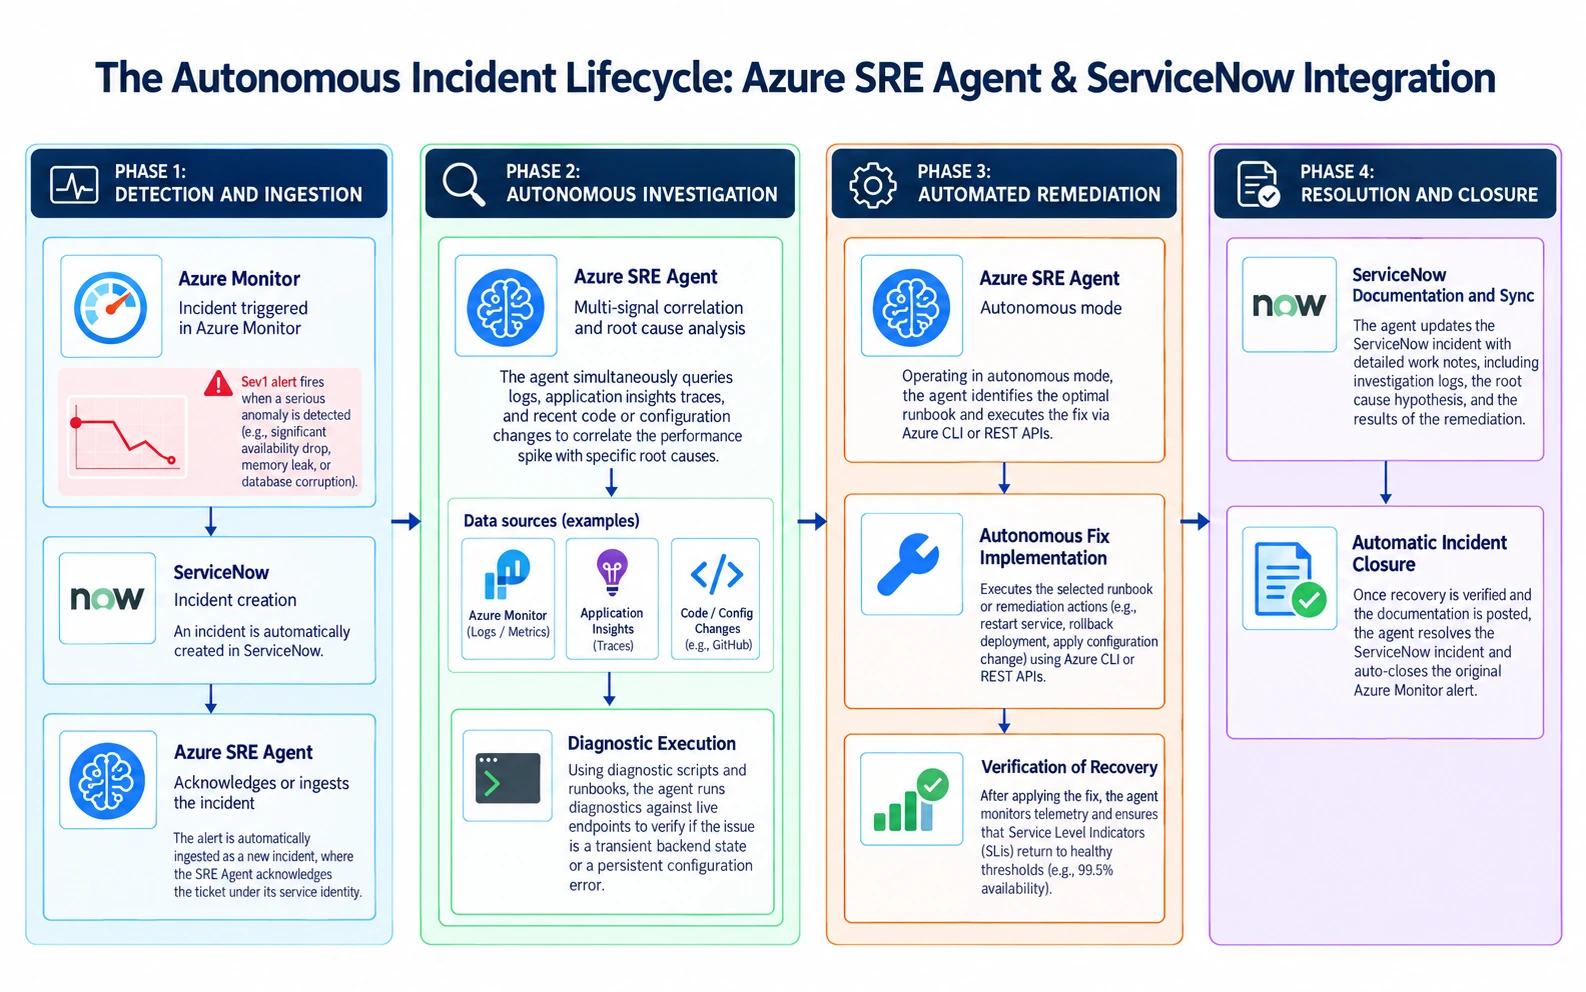
Illustration of the incident lifecycle from the ServiceNow demo, from detection through investigation, mitigation, and ticket closure (not my own run)
The investigation went in this order:
check CPU, memory, availability
inspect application logs
find an out-of-memory condition
correlate the failure with request volume
determine it is an application issue
scale the application
continue monitoring after mitigation
The response plan was autonomous, so it actually scaled the app instead of just suggesting it.
Then it watched the same signals for a set time to confirm the fix worked.
25. Handing root cause to engineering
The demo kept going after the fix.
The agent:
opened an issue
attached logs and metrics
included the evidence chain
identified the root cause
searched the source repository
mapped the fault to specific files
assigned the issue to a coding agent
received a pull request containing the code fix
The whole thing took about fifteen minutes.
What I liked was the split. The ops agent fixes the problem and proves recovery. Then engineering gets the root cause as clear, structured work instead of a vague handoff.
26. Catching drift after a fix
One subtle part came after the response plan scaled the app.
The agent compared the live Azure config to the infrastructure code and saw they no longer matched.
That matters. The next normal deployment could undo the emergency fix.
A lot of incident automation stops at recovery and misses this kind of follow-through.
27. Turning on workspace tools
Some features aren’t on by default for every agent.
For agents created before March 10, 2026, workspace file and shell access may need:
Capabilities
→ Experimental Settings
→ EnableWorkspaceTools
You can check at the resource level with:
az resource show --resource-group <resource-group> --name <agent-name> --resource-type Microsoft.App/agents --query properties.experimentalSettings -o json
Watch for portal toggles drifting between agents. Two agents in the same subscription can act differently if someone changed one by hand.
28. Code Interpreter vs workspace tools
The default Code Interpreter runs in an isolated Azure Container Apps session.
That environment had:
no outbound network
no process spawning
no pip install
no filesystem access outside /mnt/data/
Common libraries like pandas and matplotlib come preinstalled.
Workspace tools are different. They run code in the workspace tied to the connected repo.
Test whether the workspace supports the package and shell behavior your workflow needs. Don’t assume it matches the isolated interpreter.
If code execution hangs while the rest of the portal works, your corporate proxy may need to allow:
*.azuresre.ai
29. Letting the agent keep knowledge
The agent keeps a knowledge folder at:
memories/synthesizedKnowledge/
with an:
overview.md
file loaded into its system context. Linked topic files get read when needed.
You can also add knowledge straight from chat.
For example:
Save this to your knowledge: Application Insights for the Copilot Studio
agent lives in the <resource-group> resource group, and the dependency
failures we care about come from the Foundry agent, not the app servers.
The main risk is it going stale.
If the agent’s knowledge drifts from the runbooks and docs people read, you now have two versions of the truth.
Push important learned context back into the repo through a pull request. Then it gets reviewed like any other doc.
30. Repo context shapes future investigations
Once a repo is connected, the agent reads the structure, stack, and dependencies. It can create an:
SREAGENT.md
file through a pull request.
That file shapes how later investigations are grounded.
Review that PR carefully. It isn’t throwaway boilerplate.
31. Scheduling the recurring problems
Use scheduled tasks for problems that keep eating engineering time.
Here’s an example prompt:
Query Application Insights for exceptions and failed requests in the last
24 hours across every connected resource. Cluster them by exception type
and failing operation, rank by count, and for the top three trace each one
to the specific file and line in the connected repository. Report what you
found and what you would change. Don't open a PR without asking me first.
I read about one team that clustered recurring LLM errors daily, mapped them to the code, and turned them into reviewed fixes. Their errors reportedly dropped more than 80% in two weeks.
That was their result. It’s not guaranteed anywhere else.
32. Start automation in Review mode
The scheduled task field to think hardest about is:
Agent autonomy level
Here’s how I’d roll it out:
create task
set Review mode
run it manually once
inspect the thread
inspect Session insights
only then consider unattended execution
Once you have several automations, the Operations Hub shows run counts, success rates, durations, and summaries.
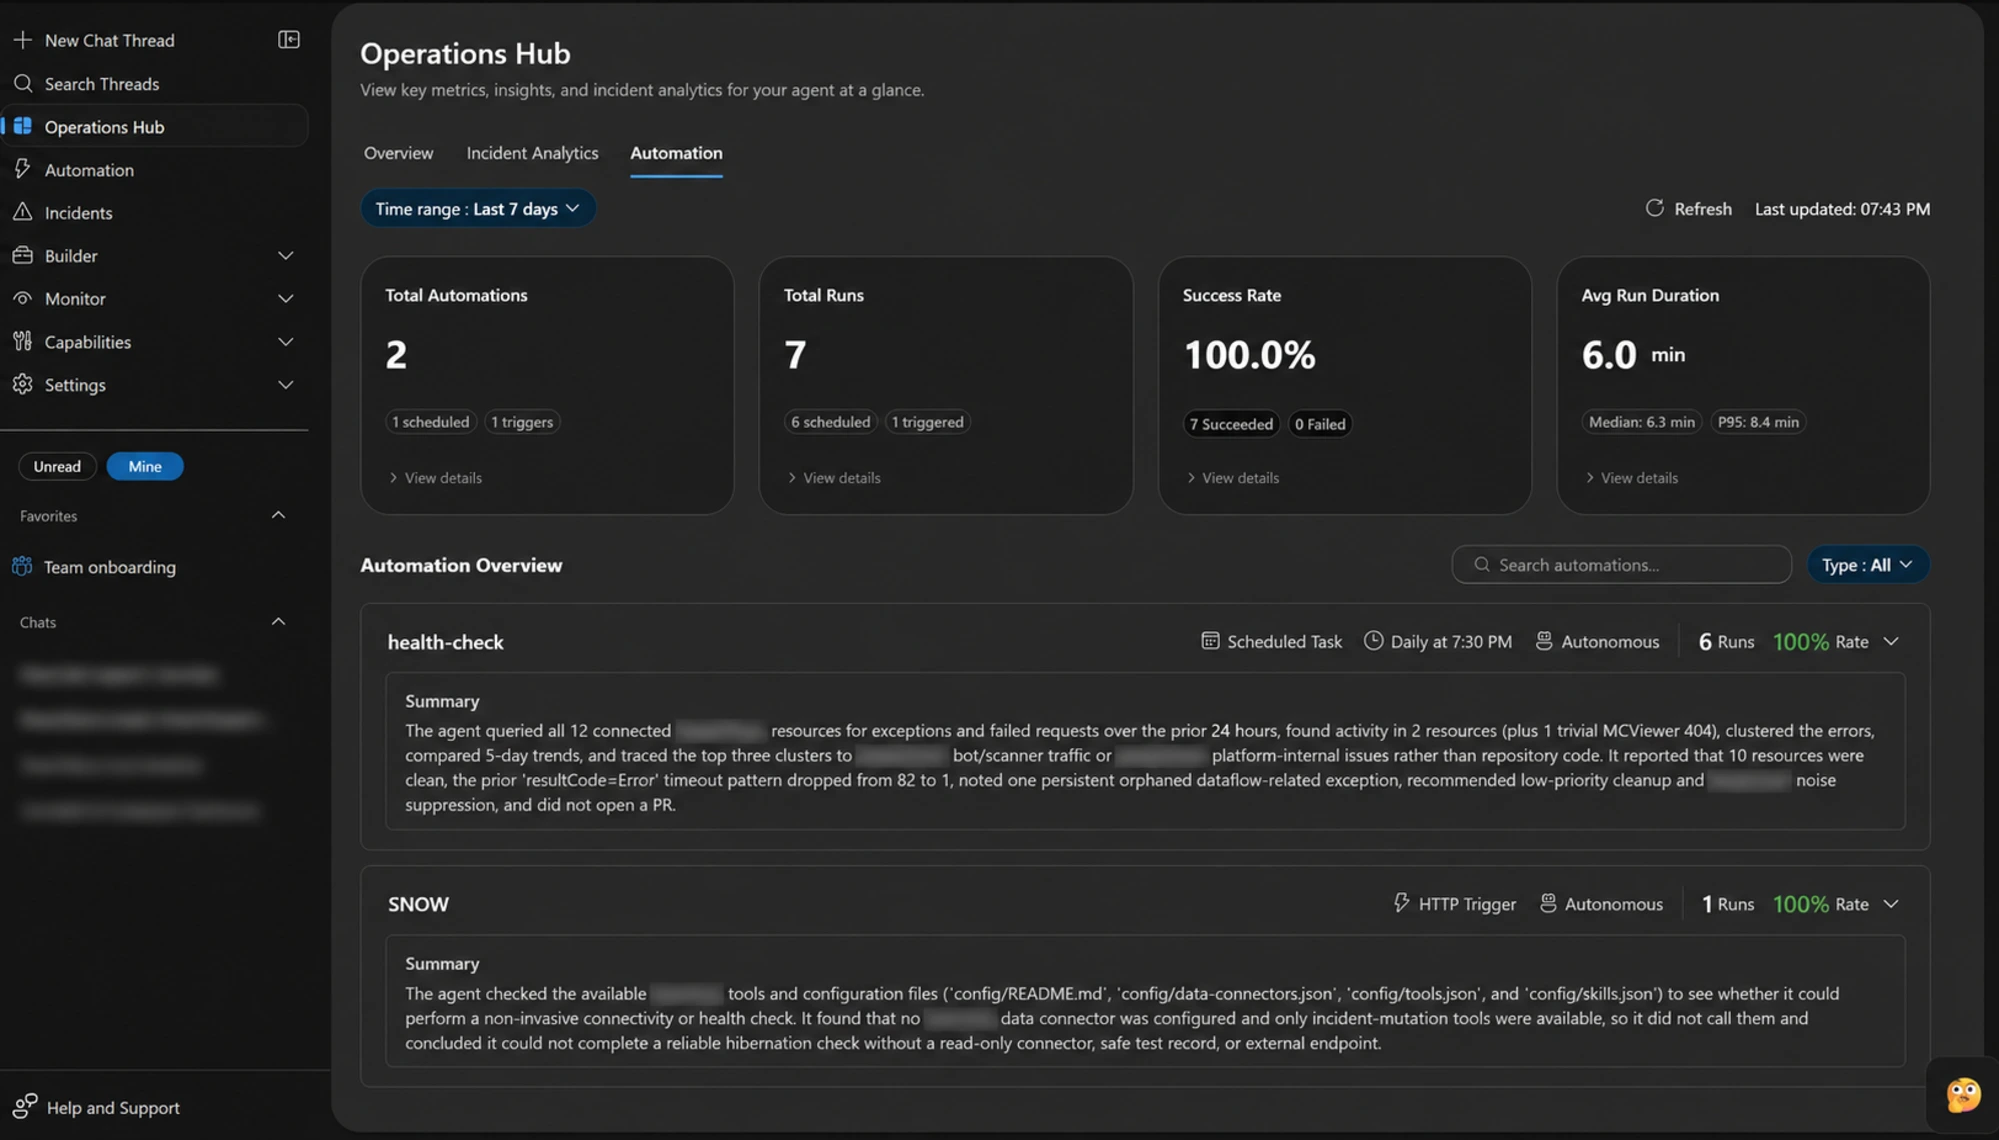
Automation Hub view showing automation runs, summaries, success status, and duration
One nice audit detail. The summary also notes what the task chose not to do, like saying no pull request was opened.
33. The Zero-Ops maturity model
The framework I landed on boils down to:
Agents operate.
Humans govern.
The maturity ladder:
Crawl
  Agent suggests.
  Human performs the work.

Walk
  Agent acts one step at a time.
  Human approves each important step.

Run
  Agent completes a bounded task.
  Human reviews the resulting diff.

Fly
  Agent fixes, deploys to test, validates the outcome,
  and presents the evidence.
  Human reviews the outcome.
My setup was mostly Crawl and Walk.
That wasn’t because the agent couldn’t do more. Most work still started with a person opening a chat.
34. Triggers move you up the ladder
A smart agent that only runs when someone opens a chat still depends on a person to start everything.
You move up by wiring:
response plans to known incident classes
scheduled tasks to recurring operational work
HTTP triggers to external systems
Better prompts alone won’t get you there.
35. Keep a human loop outside the agent
Run two loops:
agent loop
human loop
Assign each incident type to one on purpose.
Moving a type from human to autonomous should be a reviewed change with clear criteria.
Moving back should be defined too. If the automation stops meeting its safety or success bar, it falls back to humans.
The safety net belongs in the incident platform, not inside the agent.
A stuck agent can’t be trusted to report that it’s stuck.
36. Measure cost per outcome
Track:
cost per resolved outcome
not just monthly spend.
If total usage goes up but the cost per resolved incident goes down, that’s probably healthy adoption, not waste.
Decide these ahead of time:
consumption budget
who owns the budget
who can increase it
what happens when the limit is reached
37. Measure failures per tool
One overall reliability number can hide a single broken integration.
So measure:
tool failure rate by tool
instead of one success percentage.
A stale token on one connector can fail every call while the overall number still looks fine.
38. Run evals all the time
Treat evaluation as ongoing work, not a one-time test before launch.
Score production runs on:
scope adherence
correct conclusion
appropriate approval behavior
correct stop behavior
When scores drop, a scheduled task can turn that into real work instead of a report nobody reads.
39. Put agent config in source control
Microsoft’s SRE Agent repo has deployment options for:
Bicep
Terraform
PowerShell
Azure Developer CLI
plus recipes for common integrations.
That lets you treat agent config as deployable infrastructure instead of a pile of portal toggles.
Source control cuts drift between dev and production agents. Rollback becomes a normal Git operation.
40. Where I’m going next
I’m keeping my next steps small:
1. Connect one response plan to one well-understood alert class.
2. Push agent learnings back into the repository through pull requests.
3. Put agent configuration into a repeatable deployment template.
That grows autonomy slowly. I’m not handing an ops agent broad unattended control on day one.
Wrapping up
Azure SRE Agent isn’t just a chatbot bolted onto Azure.
It’s an orchestration layer that can pull together:
source code
telemetry
Azure resources
incident systems
custom tools
MCP integrations
stored knowledge
scheduled automation
human approval
The best parts weren’t just the answers. It showed the evidence it collected. It connected several systems in one investigation. It exposed permissions tool by tool. It checked that a fix actually worked. And it carried the root cause into engineering work.
The main rule is governance before autonomy. Start with read access, limited tools, review-mode automation, and narrow incident types. Add network controls, policy rules, escalation, ongoing evals, and source-controlled config before you allow unattended write access.
That’s the difference between a cool demo and an agent you can trust to keep working while the on-call engineer sleeps.